

【Market Focus Analysis】
- U.S. economic data has sent clear signals of weakness. For the week ending May 24, initial jobless claims rose to 240,000, exceeding the market expectation of 230,000; continuing jobless claims climbed to 1.919 million, reaching the highest level since November 2021. The final reading of the first-quarter GDP annualized quarter-on-quarter growth rate showed a contraction of 0.2%—though revised upward from the initial estimate, it still remained in negative territory. Driven by these data points, the probability of a rate cut in December edged up from 35% to 42%, while the 2-year U.S. Treasury yield fell to 3.987%, reducing the opportunity cost of holding gold.
- Federal Reserve officials have intensively released "patient wait-and-see" signals. Loretta Mester, President of the Federal Reserve Bank of Cleveland, emphasized the need to wait for more data to assess the impact of tariffs; Mary Daly, President of the Federal Reserve Bank of San Francisco, advocated for "avoiding hasty actions"; Raphael Bostic, President of the Federal Reserve Bank of Atlanta, predicted that the Fed might only cut interest rates by 25 basis points this year and then pause for three to six months to observe the situation. Most officials believe that economic data still shows resilience, which constitutes an implicit constraint on gold’s upward movement.
- The geopolitical situation presents a complex landscape: Houthi rebels launched hypersonic missiles at Israel’s Ben Gurion International Airport, yet Israel’s Prime Minister agreed to the ceasefire proposal put forward by the U.S.—exchanging hostages for a 60-day ceasefire. Russia and Ukraine reached a consensus on prisoner exchange in Turkey, but differences remain on core issues. Multiple geopolitical uncertainties provide fundamental support for gold.
【Gold and Silver Technical Layout】
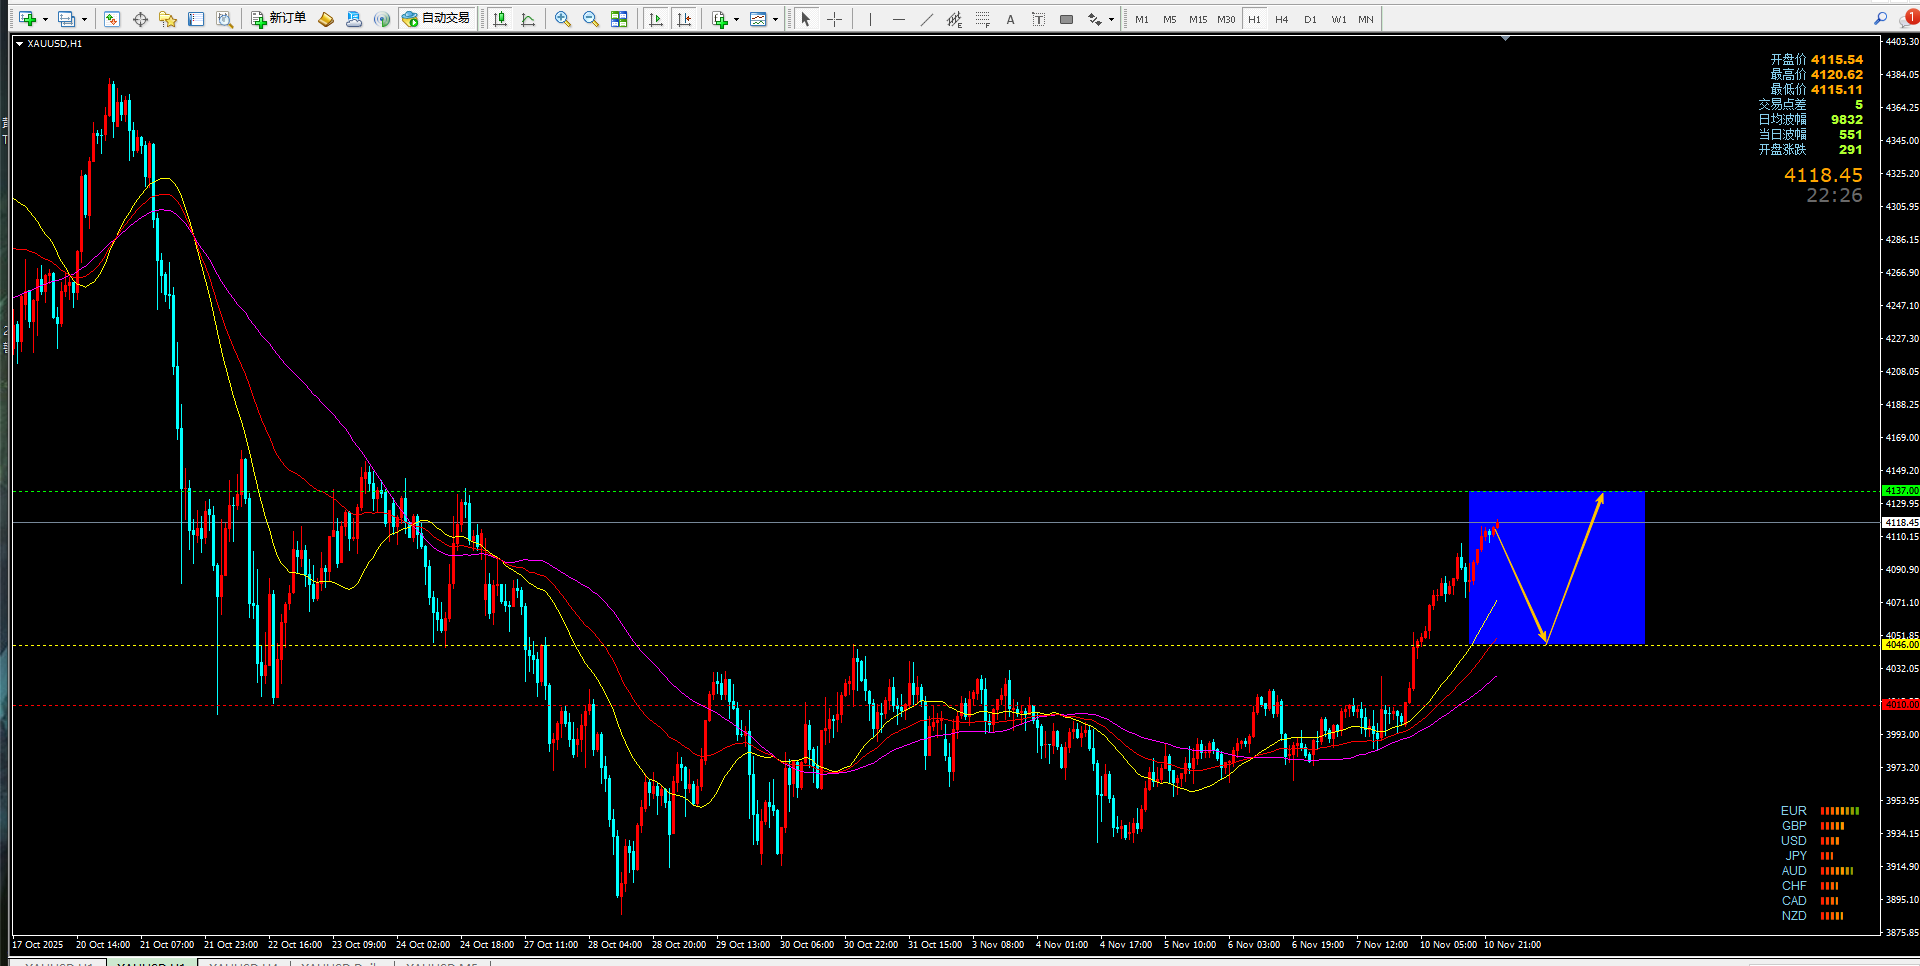
Gold
- Daily Chart Level: A large bullish candlestick closed at 4,115.78, successfully moving above the moving average, confirming a bullish pattern.
- Hourly Chart Level: It has broken through the upper edge of the pivot range, with moving averages arranged in a bullish formation.
- Trading Recommendation: Consider buying on dips around 4,090.00 at the 15-minute chart level; set a stop-loss at 4,070.00 and a take-profit at 4,210.00.
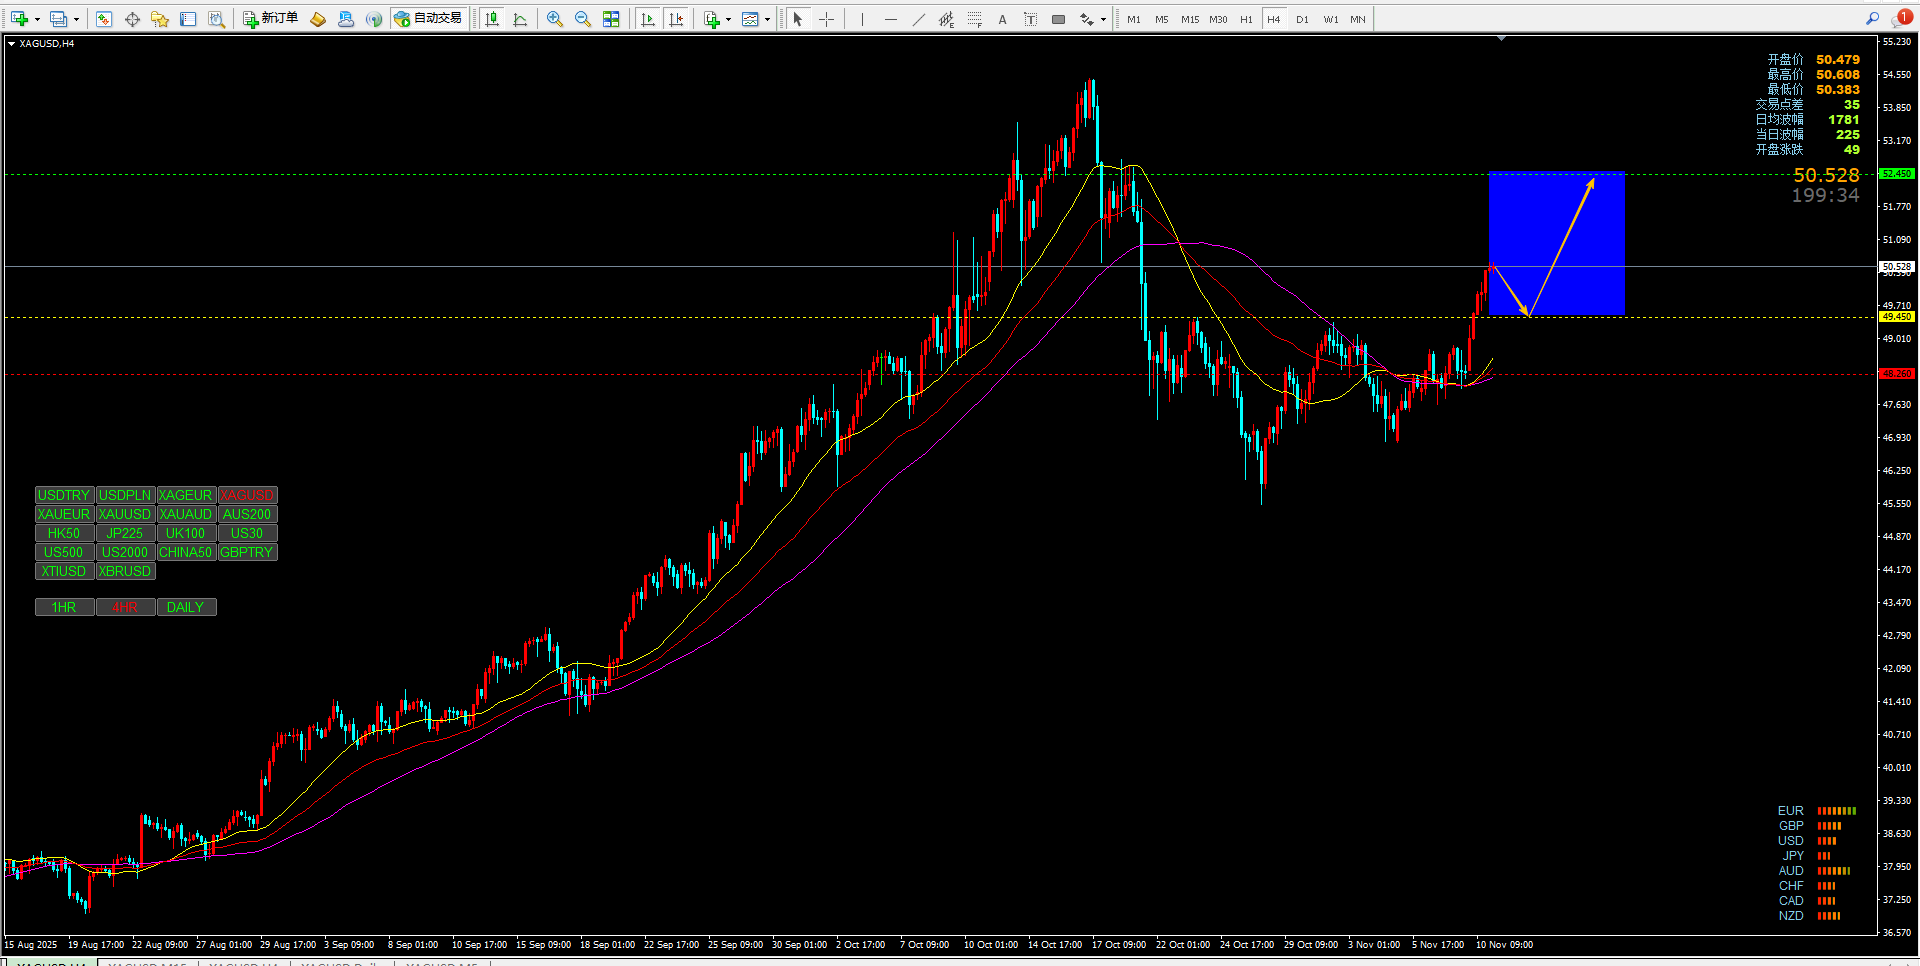
Silver
- Daily Chart Level: A large bullish candlestick closed at 50.477, returning to above the moving average, extending the bullish trend.
- Hourly Chart Level: It has broken through the upper edge of the pivot range, with sufficient momentum.
- Trading Recommendation: Consider buying on dips around 50.000; set a stop-loss at 49.600 and a take-profit at 51.300.
Risk Warning
The trading market is subject to unpredictable risks, including but not limited to the loss of principal. This analysis is for reference only and does not constitute direct investment advice. Investors should make independent judgments and decisions based on their own risk tolerance.