

October 27, 2026 | Analyst: Ma Guobang
Today's Assessment:
Gold remains in a low-level consolidation phase following its sharp decline. Today's posture maintains a range-bound bearish bias, focusing on price action around the $4,019.22–$4,019.93 zone.
Traders should wait for a confirmed 15-minute reversal pattern before assessing whether the intraday low at $4,004.12 can be retested.
I. Fundamental Anchors: Tehran Regional Coordination Talks Advance as US SPR Hits 44-Year Low
On the geopolitical front, Al Jazeera reported on October 26 that senior officials from Saudi Arabia, Turkey, and Pakistan convened in Tehran for strategic talks with Iranian officials.
Following the meeting, Iranian representatives stated that the four nations agreed to continue discussions on enhancing multilateral cooperation, with an emphasis on regional peace and security. Sustained diplomatic progress could prompt a gradual unwinding of gold's geopolitical risk premium.
Concurrently, Egypt's parliament formally authorized President Abdel Fattah el-Sisi to deploy armed forces and take necessary self-defense measures should Saudi Arabia formally request assistance. Ongoing regional security friction ensures that any fresh strikes or military mobilizations will remain an active driver for bullion safe-haven demand.
In energy markets, Reuters cited US Department of Energy figures indicating that the US Strategic Petroleum Reserve (SPR) fell to 282.6 million barrels last week, its lowest level since October 1982.
A shrinking strategic energy buffer leaves global markets acutely vulnerable to supply disruptions in Saudi Arabia and maritime transit bottlenecks.
Today's focus rests on monitoring Middle East diplomatic developments alongside physical gold's response to these evolving headlines.
II. 1-Hour and Multi-Timeframe Structure: Converging Moving Averages Amid Dominant Higher-Timeframe Resistance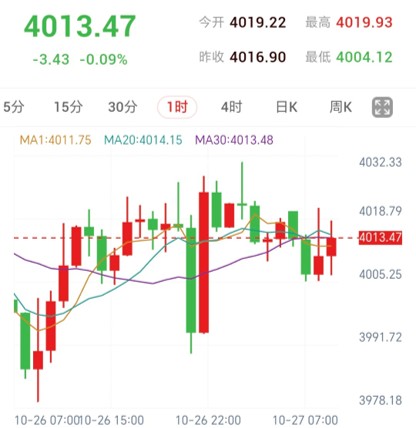
In morning trade, London gold quoted at $4,013.47 per ounce, down $3.43 or 0.09% from the previous close.
The session opened at $4,019.22, recording an intraday high of $4,019.93 against a low of $4,004.12.
Across the 1-hour timeframe:
MA1 stands at $4,011.75
MA20 stands at $4,014.15
MA30 stands at $4,013.48
All three moving averages have converged tightly, with price oscillating across this dense cluster.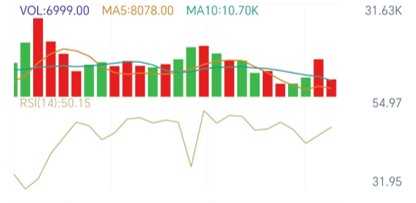
The 1-hour RSI(14) registers at 50.15, signaling near-term equilibrium between buyers and sellers. The $4,019.22–$4,019.93 band represents the session open and high, serving as immediate overhead resistance, while $4,004.12 provides the primary downside reference.
On the 4-hour timeframe, MA30 sits at $4,034.04 and slopes downward with price trading below it, while RSI(14) prints at 39.46, confirming that the larger trend remains technically soft.
On the 15-minute timeframe, RSI(14) stands at 47.83, where recent intraday probing was met with quick rejections, printing candles with elongated wicks that highlight active short-term two-way tugs-of-war.
III. Intraday Trading Execution Plan
Strategy Direction: Look for trend-following short opportunities once rebound momentum exhausts
Focus Zone: $4,019.22—$4,019.93 (Zone coinciding with session open and daily high)
Trigger Conditions: Price rebounds into the zone; wait for a 15-minute candle to close back below $4,019.22; wait for a subsequent 15-minute close beneath the low of that rejection candle; enter shorts only if a subsequent retest fails to reclaim that low
Target Levels: Target the session low near $4,004.12, evaluating buyer absorption at that boundary
Stop-Loss Reference: Placed strictly above the confirmed swing high established during the 15-minute rejection structure, verifying risk distance before entry
Invalidation Condition: A 1-hour candle closes above $4,019.93, followed by a 15-minute retest that holds above $4,019.22, invalidating the bearish bias in favor of an extended recovery
[Cancellation Pre-conditions]
Prior to execution, if a 15-minute candle closes above $4,019.93 and holds above $4,019.22 on a pullback, or if price drops directly to $4,004.12 without a rebound, cancel the setup.
IV. Risk Warning
The 15-minute structure remains choppy. Following pattern confirmation, strictly verify the remaining profit distance to $4,004.12; if the risk-reward ratio is insufficient, abandon entry.
(Compiled and Edited by Lucky Gold Global Limited)
Gold Consolidates in Tight Range Following Steep Drop, Watching for Rejection Signals Near $4,019 Resistance
Published: 2026-10-27 09:35:45