

I. 1-Hour Downtrend Extends as Gold Breaches Multiple Moving Averages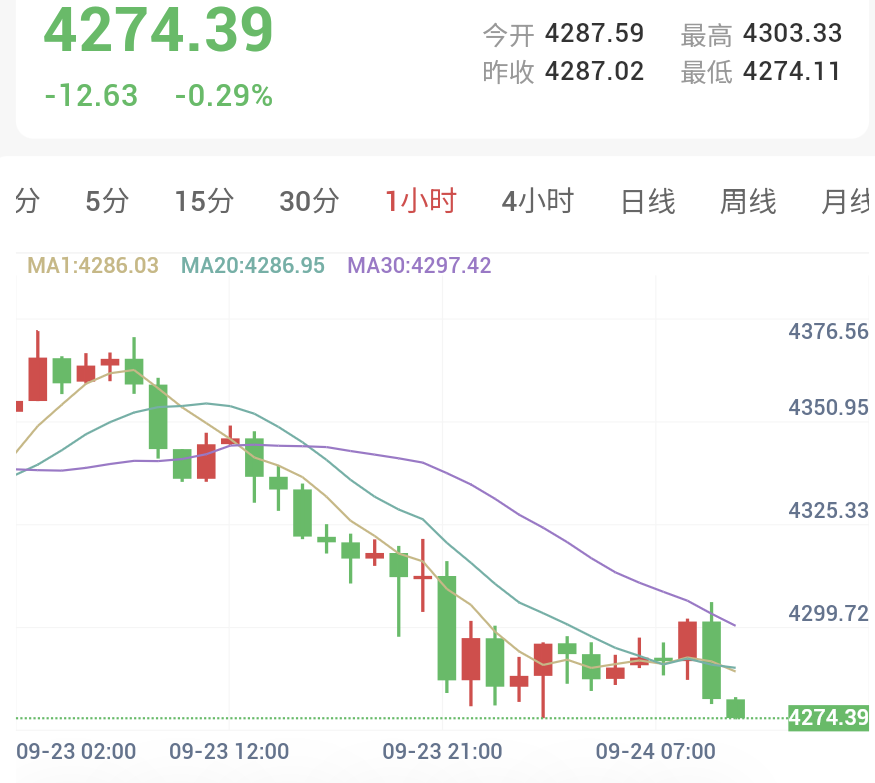
On the 1-hour timeframe, spot gold displays sustained near-term technical weakness. Real-time prices printed at $4,274.39/oz, down 0.29% intraday, spanning a daily range between a high of $4,303.33 and a low of $4,274.11.
Concurrently, price action decisively broke below the key 55-day moving average situated near $4,287. Failure to swiftly reclaim the 55-day MA alongside the 1-hour 20-MA risks extending short-term vulnerability; conversely, a rapid recovery back into the $4,286–$4,300 zone would signal that downward momentum is beginning to stall.
II. Fed Policymakers Signal Tightening Path as Year-End Rate Hike Odds Surge
Precious metals faced aggressive liquidation on Wednesday. Following the Federal Reserve's initial 25 bps rate hike of the cycle in September, multiple policymakers continued to emphasize lingering inflation threats and hawkish terminal pathways. Market expectations for additional rate hikes before year-end escalated rapidly, driving simultaneous gains across the greenback and sovereign yields while pinning gold lower.
Chicago Fed President Austan Goolsbee warned that persistent energy shocks could continue feeding into aggregate inflation. Richmond Fed President Tom Barkin and Boston Fed President Susan Collins echoed heightened inflation concerns, expressing openness to further tightening. Fed Governor Michael Barr noted that recent moves represent an ongoing recalibration that may require additional action. Interest rate markets repriced accordingly: CME FedWatch figures showed a notable increase in the odds of an October 25 bps rate hike, alongside elevated positioning for a follow-up move before December, reinstating Fed policy expectations as the primary driver of short-term gold trades.
III. Dollar Index Touches 101 as Resilient US Macro Data Exacerbates Bullion Selling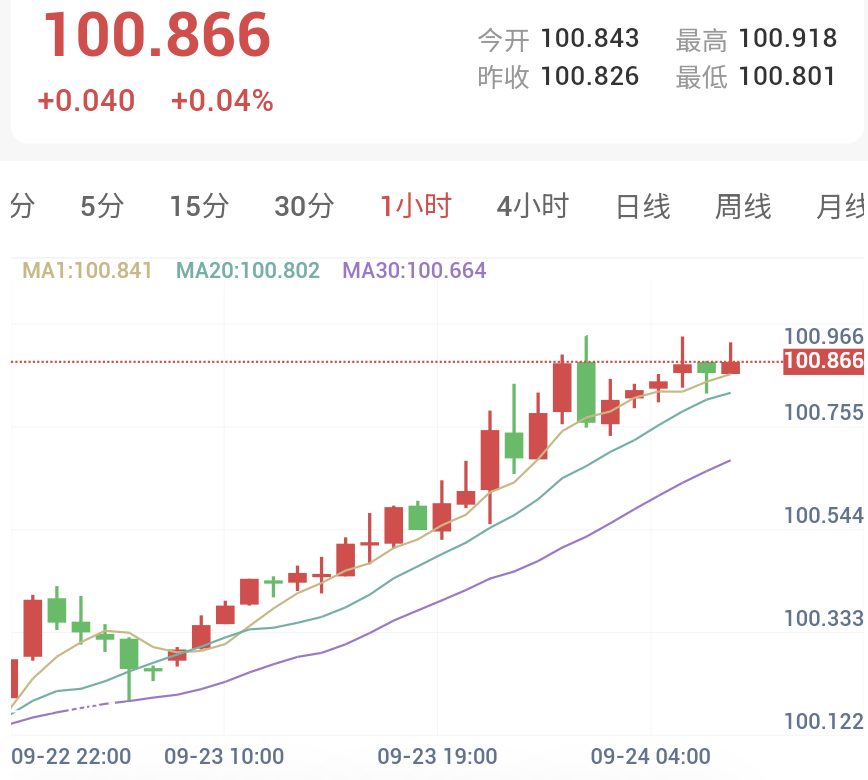
Dollar strength provided a formidable headwind for bullion, with the US Dollar Index advancing 0.58% on Wednesday to touch an intraday peak of 100.966—its highest reading since July 29.
Macroeconomic data reinforced this upward trajectory. S&P Global's flash US Composite PMI Output Index climbed from 56.0 in August to 58.4 in September, marking its highest reading since July 2021 on the back of accelerating new orders. Treasury markets experienced heavy selling pressure, driving the benchmark 10-year yield to 5.108% (peaking at 5.135%) in territory unseen since 2007. The 2-year/10-year yield spread flattened further, underscoring aggressive inflation repricing. Pressured by rising real yields and a firmer greenback, spot gold plunged over 1.7% on Wednesday, retreating nearly $80 from session peaks to hit its lowest level since September 17.
IV. Middle East Rhetoric Flares as Energy Volatility Fails to Counter Gold Weakness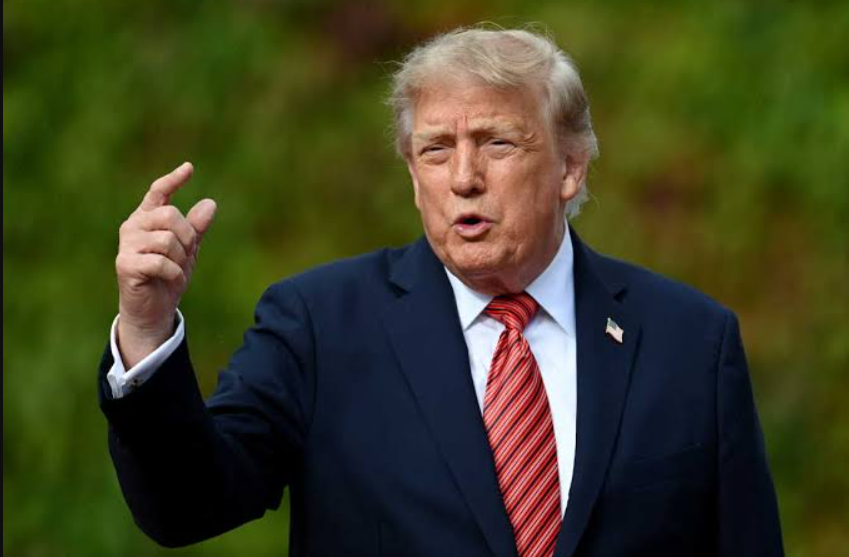
President Donald Trump issued stern warnings toward Iran during his UN address, to which Iranian President Pezeshkian responded that Tehran would not yield to external coercion while remaining open to diplomatic channels. This geopolitical friction prompted market participants to re-evaluate regional risks, lifting energy benchmarks nearly 4% intraday.
However, renewed geopolitical tensions failed to generate durable safe-haven flows into bullion. Broad market focus remained firmly anchored on Federal Reserve monetary projections, robust US economic releases, the advancing dollar, and elevated sovereign yields, preventing safe-haven interest from offsetting macro selling pressure.
V. Market Focus Shifts to Bilateral Summits, Jobless Claims, and Fedspeak on September 24
Trading focus on September 24 will center on high-level bilateral summits, where trade, technological rivalry, and regional security could prompt cross-asset volatility. US initial jobless claims also warrant scrutiny, offering fresh insight into labor market durability and broader economic resilience.
Additionally, scheduled commentary from Federal Reserve officials could further shape market pricing for October and December policy meetings. With gold testing support beneath the 55-day moving average and short-term moving average bands, whether the US Dollar Index sustains stability above 101 and whether Treasury yields push higher will serve as paramount indicators for potential near-term price stabilization.
Hawkish Fedspeak Weighs on Bullion as Gold Plunges Nearly $80
Published: 2026-09-24 10:32:22