

I. News Events
1. US Jobless Claims Hold Near Lows as Labor Market Expansion Stagnates
According to the latest Department of Labor figures, US initial jobless claims ticked down to 197,000 last week.
The print has hovered near 57-year lows for four consecutive weeks.
However, when paired with September's subdued non-farm payroll addition of just 29,000, expansionary momentum in hiring remains visibly muted.
Economists highlight that the US labor backdrop continues to exhibit a pronounced 'low hiring, low firing' equilibrium.
Faced with tariff uncertainties and elevated energy costs from Middle East tensions, firms are retaining existing personnel while showing minimal appetite to expand payrolls.
2. Fed Officials Reiterate Inflation Fight; December Hike Odds Exceed 80%
On monetary policy, St. Louis Fed President Alberto Musalem stated that further policy tightening remains necessary to return inflation sustainably to the 2% target.
Interest rate futures pricing currently indicates that traders assign only a 17% probability to an October rate hike.
Conversely, the perceived likelihood of a rate increase in December stands at 83%.
II. 30-Minute Chart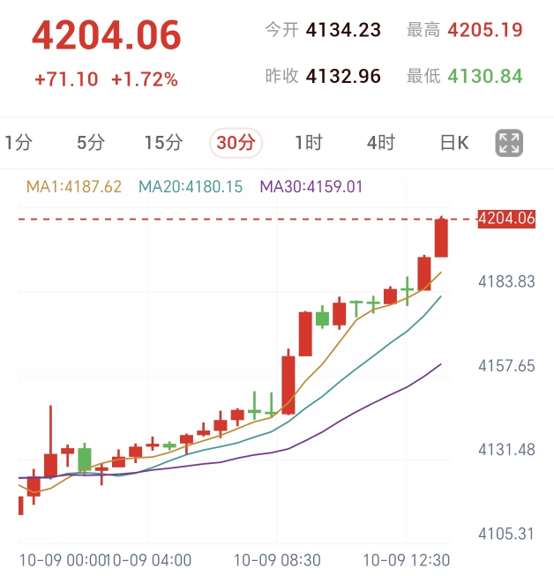
As of 13:32 Beijing time, spot gold traded at $4,204.06 per ounce, staging a massive 1.72% rally (up $71.10 intraday).
Initiating from near $4,130 in early trading, bullion executed a remarkably smooth, unilateral short squeeze on expanding volume.
Short-term moving averages have configured into a steep, pristine bullish alignment.
MA1 ($4,187.62), MA20 ($4,180.15), and MA30 ($4,159.01) are fanning upward at sharp angles.
Candles continue to suspend well above the moving average cluster, slicing cleanly through psychological round numbers at $4,150 and $4,200.
Bullish capital remains in decisive command of the price action.
III. 30-Minute Technical Indicators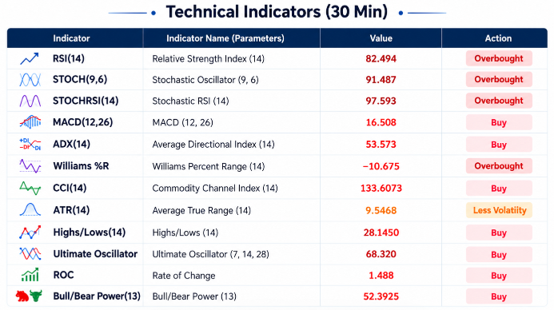
Across 30-minute technical metrics, the comprehensive rating has shifted to an overwhelming 'Strong Buy' (7 bullish, 0 neutral, 0 bearish).
While upward momentum has expanded exponentially, several sensitive indicators have pushed deep into extreme overbought territory:
Core Relative Indicators:
Relative Strength Index RSI(14): 82.49, deep within acute overbought territory.
Stochastic STOCH(9,6): 91.49, holding in extreme overbought parameters.
Commodity Channel Index CCI(14): 133.61, sustaining a solid buy rating.
Trend Momentum Indicators:
Moving Average Convergence Divergence MACD(12,26): 16.51, fanning out sharply above the zero line with robust bullish conviction.
Average Directional Index ADX(14): 53.57, exceptionally elevated, confirming substantial institutional continuity behind the rally.
Rate of Change ROC: 1.488, signaling active buying interest.
Bull/Bear Power(13): 52.39, with buyers entirely dominating downside forces.
Oscillator and Overbought/Oversold Metrics:
Fast stochastic StochRSI(14): 97.59, pressing directly against the upper overbought extreme.
Williams %R: -10.68, deeply anchored in overbought levels.
Average True Range ATR(14): 9.55, reflecting localized volatility compression (Less Volatility).
IV. Summary and Outlook
Looking ahead, gold has decisively conquered the $4,200 milestone, supported by the steep upward fanning of the moving average matrix.
However, technical readings warn that RSI, StochRSI, and Williams %R have all converged into extreme overbought zones.
ADX crossing above 53 also indicates that short-term unilateral sentiment is approaching an interim peak.
Traders should stay alert to potential profit-taking, position turnover, and corrective pullbacks above $4,200.
Initial downside defense rests within the MA1 and MA20 moving average bands.
Should prices digest these extreme overbought readings through high-level sideways consolidation, bullion will preserve the structure required to challenge higher levels.
US Jobless Claims Remain Low as Gold Surges Strongly on Middle East Ceasefire Hopes
Published: 2026-10-09 14:15:26