


【Market Focus Analysis】
- U.S. Treasury yields continued their upward trend, with the 10-year Treasury yield approaching the 4.10% mark, having risen by more than 20 basis points in total from last week’s low. The rise in yields directly increases the cost of holding gold—every 10-basis-point increase in yields raises the annual cost of holding gold by approximately 0.1%. U.S. dollar bond funds fell for two consecutive days, with the KF6799 fund closing at 0.9910, reflecting the deepening of market pricing for interest rate risks. The negative correlation between U.S. Treasury yields and gold prices rose to 0.8 (a three-year high).
- U.S. economic data reinforced the "soft landing" narrative. The annualized quarter-on-quarter GDP growth rate for the third quarter remained at 2.8%, personal consumption expenditures rose by 2.9% year-on-year, and the ISM Non-Manufacturing PMI for October climbed to 55.2. Core inflation stickiness persisted: the core PCE price index for October was up 3.5% year-on-year, and service sector inflation reached 5.1% year-on-year. The combination of "stable economy + high inflation" shattered expectations of monetary easing, with the market’s expected probability of a December rate cut dropping from 60% at the start of the month to below 40%.
- No new signals of escalation emerged in the global geopolitical landscape. Military operations in the Middle East maintained their current intensity, and the Russia-Ukraine conflict remained in a stalemate. China-U.S. economic and trade consultations released a signal of "avoiding escalation of frictions." The scale of U.S. gold imports from Switzerland was limited (only 20.6 tons in 2024), so tariff shocks had no substantial impact. There was a lack of new driving factors in terms of geopolitics and trade.
【Gold and Silver Technical Layout】
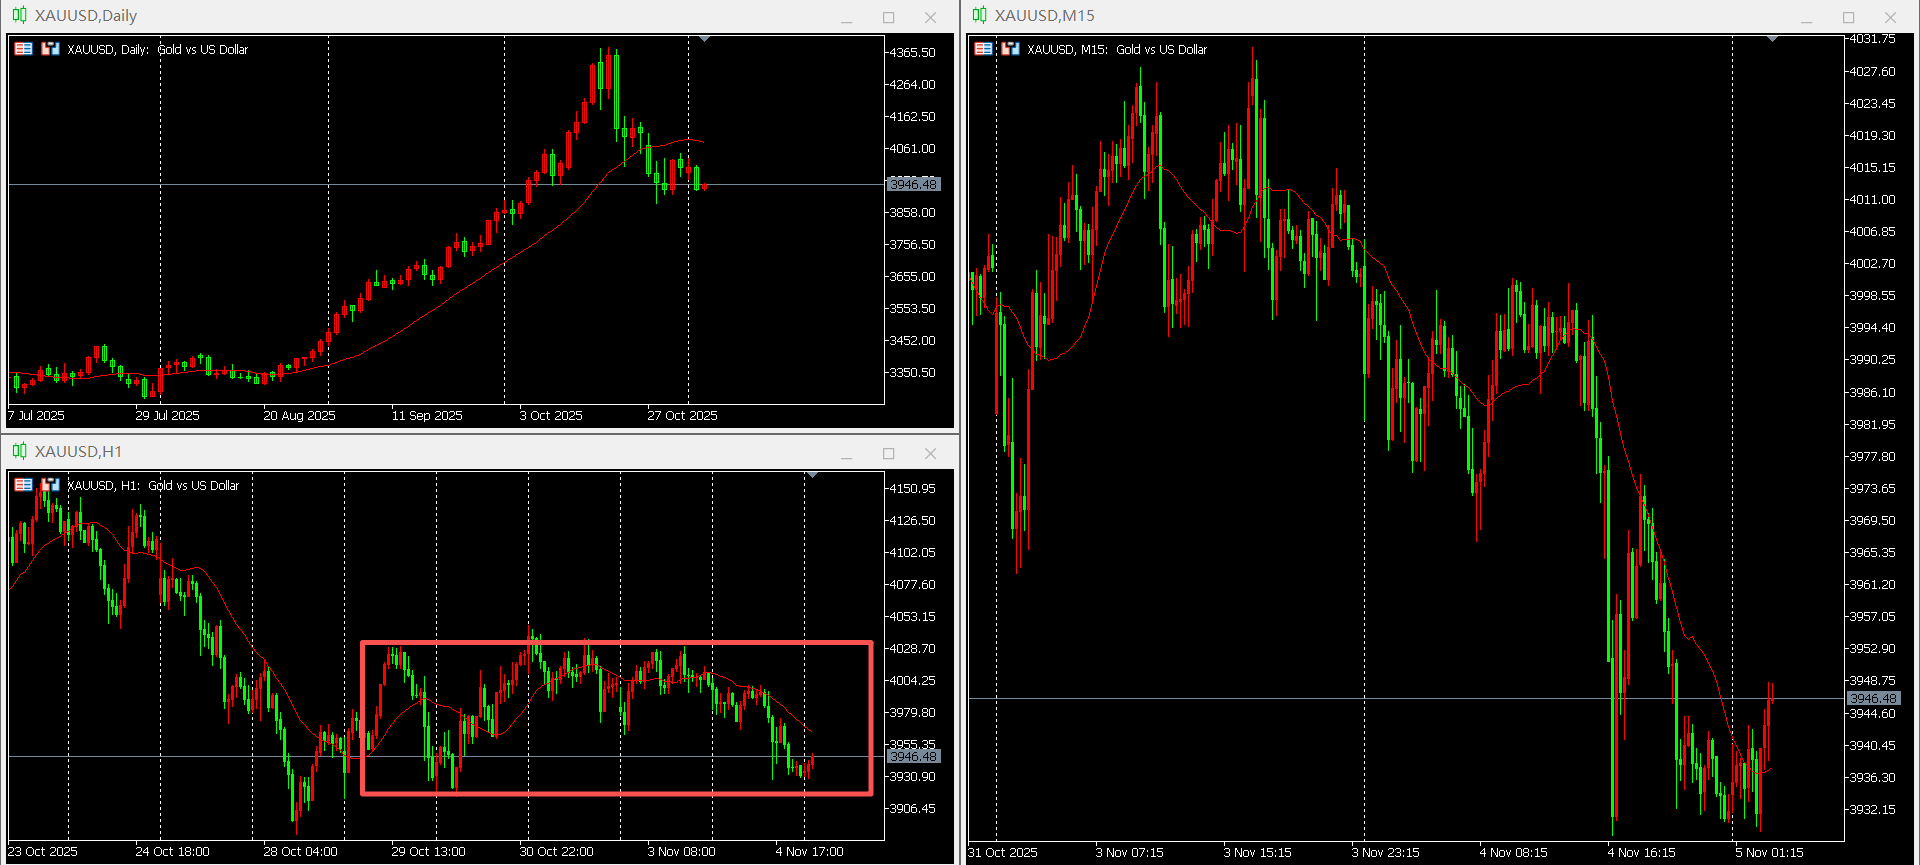
Gold
- Daily Chart Level: A medium bearish candlestick closed at 3,931.90, trading below the moving average, with the bearish pattern continuing.
- Hourly Chart Level: Oscillating at the pullback bottom; focus on support around 3,900.00.
- Trading Recommendation: Consider buying on dips around 3,910.00 on the 15-minute timeframe, with a stop-loss at 3,900.00 and a take-profit at 3,960.00.
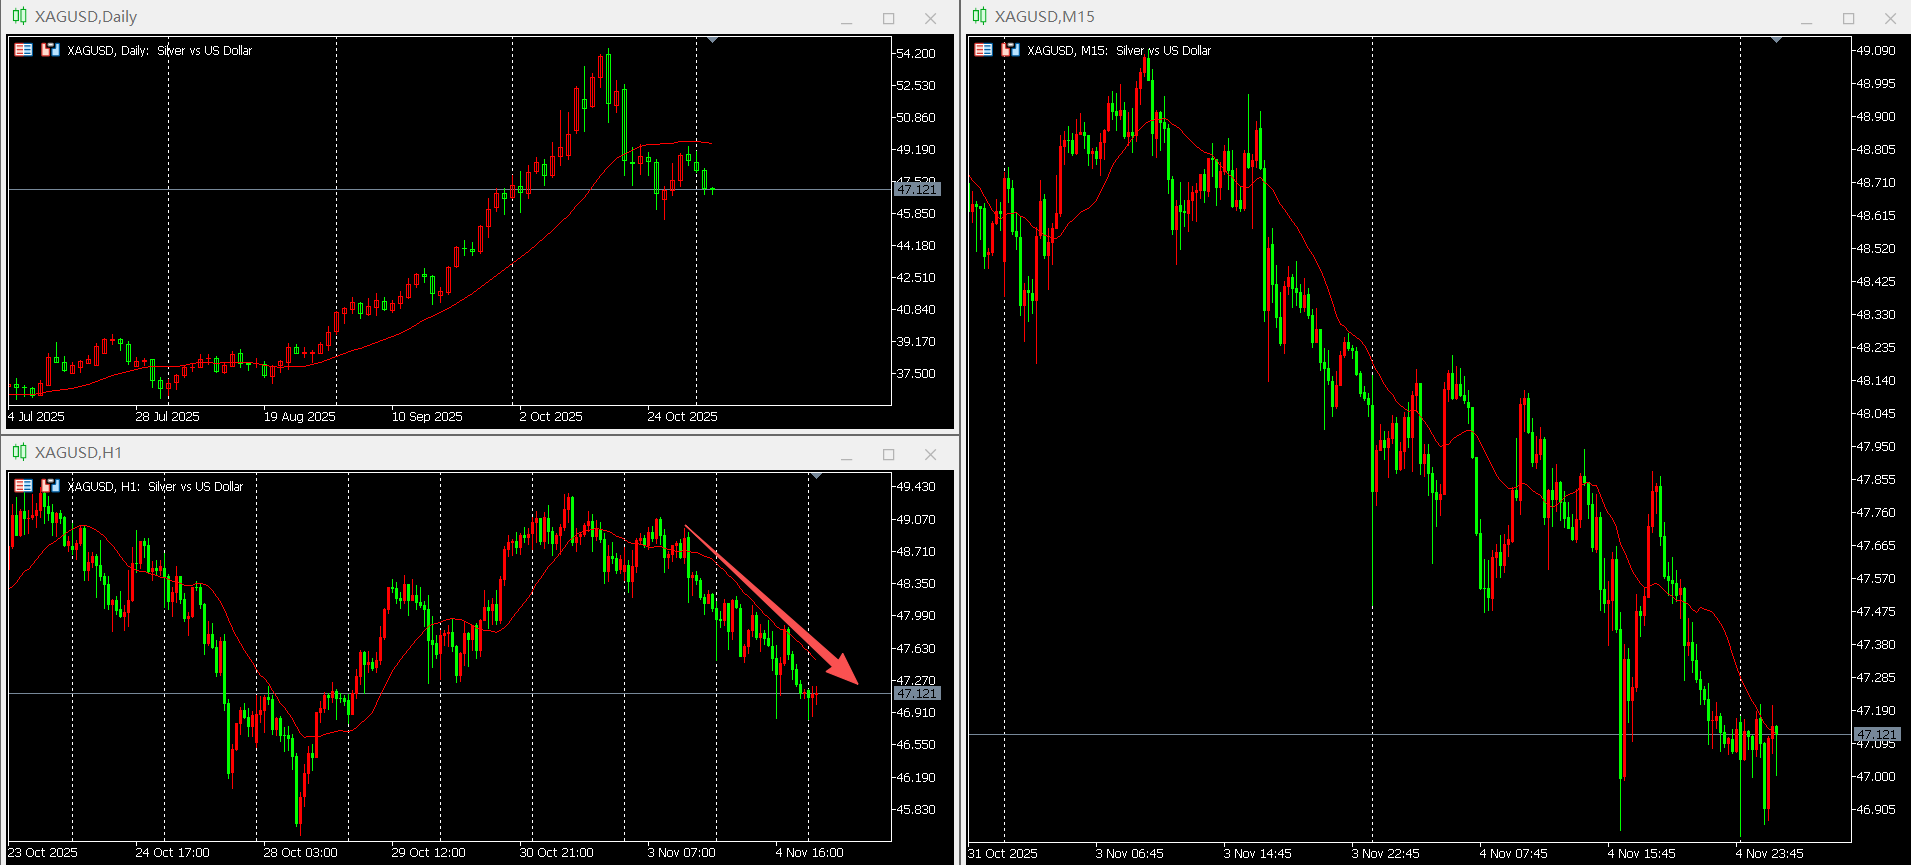
Silver
- Daily Chart Level: A medium bearish candlestick closed at 47.134, trading below the moving average, forming a secondary downward trend.
- Hourly Chart Level: Declining in a narrow channel, with moving averages in a bearish alignment.
- Trading Recommendation: Consider short positions on rallies around 47.300, with a stop-loss at 47.800 and a take-profit at 46.300.
Risk Warning
All investments involve risks, including the risk of capital loss. This recommendation does not constitute specific investment advice. Investors should make decisions based on their own risk tolerance, investment objectives, and market conditions.