

Focus Shifts to Major Inflation Data This Week (2026/09/08)
1. Fundamental Analysis
Strong NFP Impact Persists, Rate Hike Expectations Remain Elevated:
The U.S. August NFP added 162k jobs, significantly beating market expectations, with the unemployment rate holding at 4.1%. This keeps expectations alive for a September rate hike, currently hovering around 58%. This week's upcoming inflation data will thoroughly ignite the two-way battle between bulls and bears.
Middle East Tensions Continue to Heat Up, Energy Prices Nudge Important Psychological Marks:
Strait of Hormuz shipping risks persist, and regional military friction has not noticeably cooled, with Brent briefly rising near $98. This simultaneously increases market safe-haven sentiment and heightens concerns over a resurgence of future inflation, exerting a dual impact on policy expectations.
This Week's Focus Shifts to PPI and CPI:
As U.S. markets resume normal trading following the Labor Day holiday, investors will re-evaluate bond yields and dollar performance. The true vital milestones remain Thursday's PPI and Friday's CPI. If core inflation continues to recede, current elevated rate hike bets could cool down; conversely, a re-acceleration in inflation could reinforce hawkish policy expectations.
2. Technical Analysis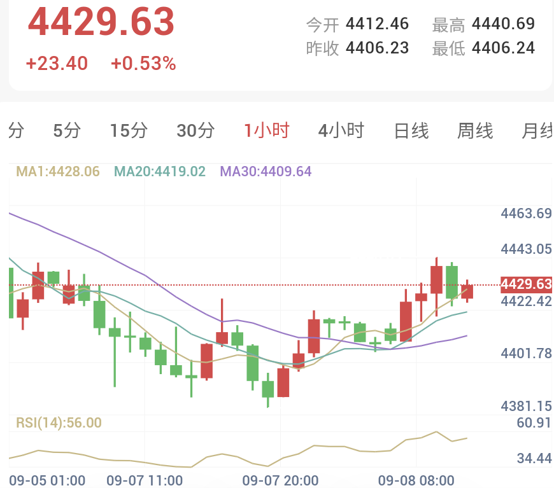
1-Hour Timeframe (Intraday Short-Term: Bullish Correction)
• Trend Assessment: The 1-hour chart currently operates near 4,429.63, with today's high at 4,440.69 and low at 4,406.24.
Prices have climbed above MA1, MA20, and MA30, recovering progressively from lows near 4,380 and exhibiting clear short-term structural correction.
However, prices are now approaching recent overhead resistance in the 4,440–4,443 band, limiting the advantage of chasing highs at current levels.
• Indicator Monitoring: RSI(14) registers at 56.00 in the neutral-to-bullish zone, without entering deeply overbought territory.
4-Hour Timeframe (Medium-Term Trend: Awaiting Directional Confirmation)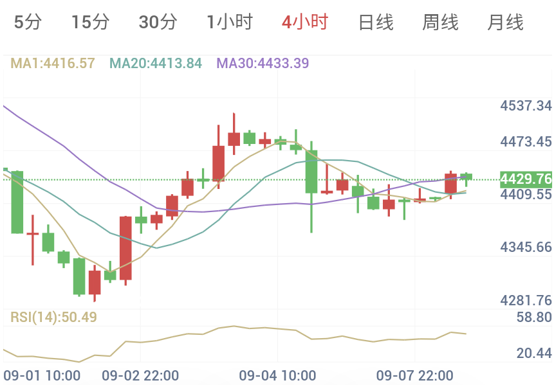
• Trend Assessment: The 4-hour chart stands at roughly 4,429.76, operating above MA1 and MA20, though still slightly below MA30.
The pullback originating near 4,470 has been partially repaired, but prices remain capped below the crucial moving average resistance near 4,433. Thus, it is premature to confirm a full resumption of a 4-hour bullish trend.
• Indicator Monitoring: RSI(14) registers at 50.49 in the neutral zone, indicating balanced short-term bull-bear momentum on the 4-hour chart.
3. Trading Execution Plan
While the 1-hour timeframe has shifted to bullish correction, the 4-hour chart has yet to decisively breach major resistance. Multi-timeframe structures lack complete alignment; hence, today's core plan is to continue observing.
• Strategy Direction: Continue Observing
• Trading Signal: Observe
• Confidence Index: 45 / 100
• Observation Zone: 4,409.55 - 4,443.05
• Zone Midpoint: 4,426.30
• Current Reference: 4,429.63
[Execution Details]
With prices currently positioned in the upper-middle section of the observation zone, chasing highs or sell-offs directly inside the band is not recommended.
If the 1-hour chart can decisively stabilize above 4,443 and successfully defend a subsequent pullback near 4,440, the short-term recovery structure will strengthen further, allowing for a reassessment of bullish plans.
Conversely, if prices break back below 4,409 and failed rallies cannot reclaim it, it signifies the failure of this rebound attempt, turning the short-term structure bearish again.
Before an effective breakout occurs within the 4,409–4443 range, waiting is advised without forcing directional commitments. Exact entry, stop-loss, and take-profit levels should be re-established only after breakout confirmation.
Risk Disclaimer
Financial trading involves unpredictable risks, including but not limited to the loss of principal. This analysis is for reference only and does not constitute direct investment advice. Investors should make independent judgments and decisions based on their own risk tolerance.