

Strong NFP and US-Iran Conflict Keep Gold and Silver Range-Bound with a Bullish Tilt
Market Fundamentals Overview
U.S. August non-farm payrolls significantly beat expectations, pushing the implied probability of a September Fed rate hike above 60%. As the market awaits this week's PPI and CPI releases for monetary policy guidance, tightening expectations continue to keep gold and silver oscillating near key technical barriers. Non-farm payrolls rose by 162,000 in August, nearly tripling forecasts, while the unemployment rate held at 4.1%. Following the data, interest rate futures priced in a 60.4% chance of a 25 bps hike at the September meeting. With 10-year Treasury yields elevated, the opportunity cost of holding non-yielding metals remains high. This week's PPI and CPI prints serve as the Fed's final core inflation indicators ahead of the September FOMC meeting.
Military clashes between the U.S. and Iran continue to escalate. Iran warned of strikes against Middle East energy infrastructure, while transit volume through the Strait of Hormuz hit its lowest level since May. International crude prices reached six-week highs, stoking concerns over persistent inflation and creating a tug-of-war between safe-haven flows and hawkish pressures. Over the weekend, reciprocal strikes hit tankers and naval vessels in the most severe confrontation to date. Iran stated that further American strikes would prompt attacks across Middle Eastern energy facilities, while daily commercial vessel traffic through the Strait dropped to just 10 ships.
The People's Bank of China expanded its gold reserves for the 22nd consecutive month, with August additions hitting a cyclical high. Continued strategic accumulation by global central banks provides a firm medium-to-long-term floor for gold and silver. Official data indicates China's gold reserves reached 76.73 million ounces at the end of August, an increase of 650,000 ounces (approx. 20.22 tonnes)—the largest single-month increase since buying resumed in November 2024. Global central bank net purchases expanded sharply year-over-year in Q2, reflecting sustained demand for de-dollarization and reserve diversification, effectively limiting the depth of near-term pullbacks.
Trading was subdued due to the U.S. Labor Day holiday, while resilient industrial demand supported a valuation rebound in silver, leading silver to outperform gold and tightening the gold-to-silver ratio. With U.S. equity markets closed for the holiday, precious metals volume remained light, narrowing intraday ranges.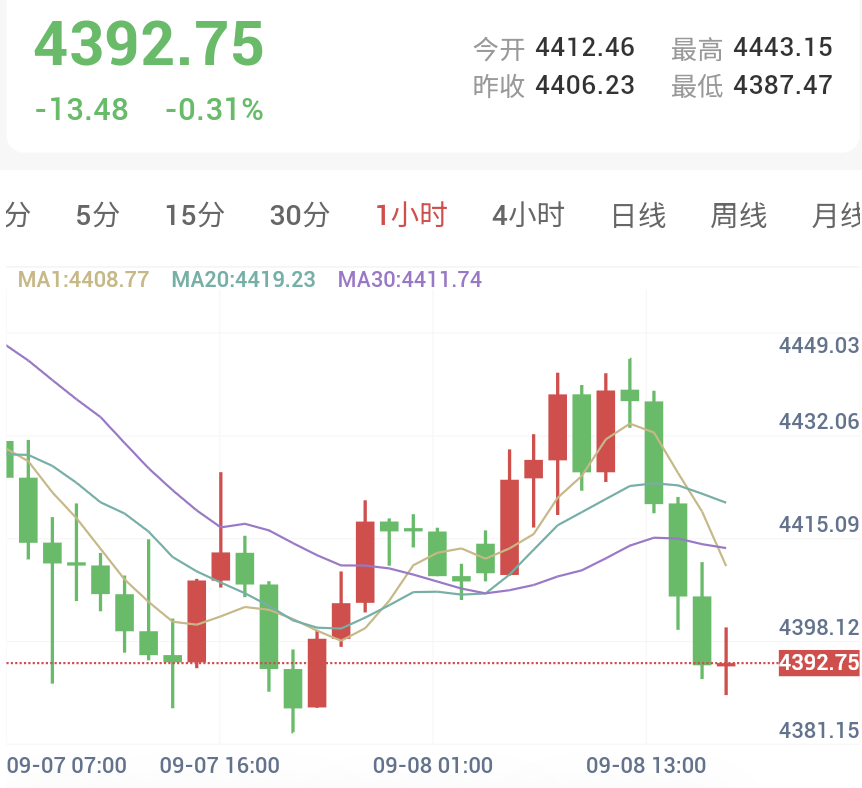
Gold Technical Analysis
• Daily Timeframe: Spot gold opened at $4,412.46/oz during the Asian session and trended higher within a range, maintaining a bullish macro bias. Moving averages remain in a golden cross. Medium-term long positions initiated around 4,406.23 should be held, with stop-loss protection set below the 4,282 low, targeting prior swing highs or exiting at a 1:2 risk-to-reward ratio if momentum continues.
• Intraday Short-Term (1-Hour): Moving averages are arranged in a bullish formation. A decisive break above the 20-period MA at 4,419.23 offers an entry for long positions, with a stop loss referenced below the 4,387.47 low and an exit planned at a 1:2 risk-to-reward ratio.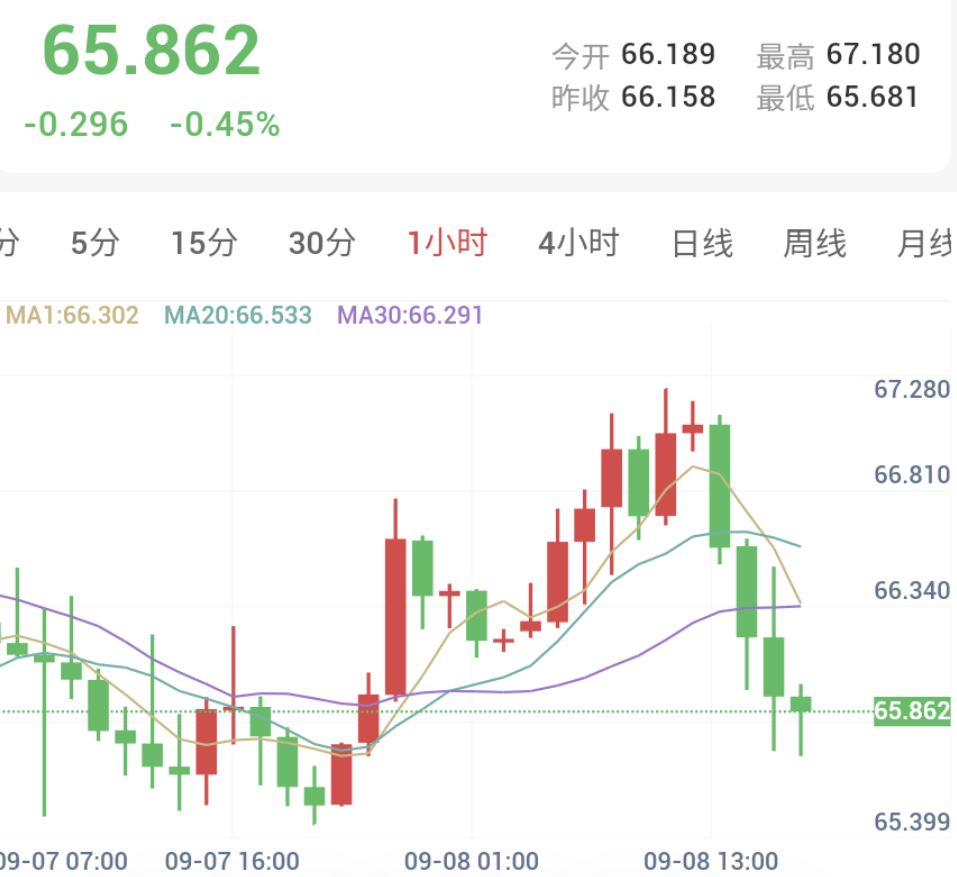
Silver Technical Analysis
• Daily Timeframe: Spot silver opened at $66.189/oz and traded upward within a range, touching a session high of 67.180 with an intact bullish bias. Moving averages have crossed into a golden cross. Medium-term longs opened at 66.158 should be held, referencing stops below the 63.300 low and targeting 71.000, or exiting via trailing MA stops or a 1:2 risk-to-reward ratio.
• Intraday Short-Term (1-Hour): Moving averages display a bullish alignment. A break above the 20-period MA at 66.533 triggers a long entry, with stops placed below the 65.681 low, targeting a 1:2 risk-to-reward exit.
Risk Disclaimer
Financial markets involve unpredictable risks, including but not limited to the loss of principal. This analysis is for reference only and does not constitute direct investment advice. Investors should make independent judgments and decisions based on their own risk tolerance.