

Middle East Conflict Escalates as Gold Faces Downward Pressure (2026/09/09)
1. Fundamental Analysis
Inflation Concerns Resurface as the Primary Market Driver:
Tensions in the Middle East have continued to escalate. On Tuesday night, Iran-backed Houthi forces launched large-scale strikes across southern Saudi Arabia, covering four cities. Saudi officials confirmed that the attacks resulted in numerous civilian injuries. Brent crude briefly approached the $100 psychological threshold intraday, keeping energy, transportation, and enterprise input costs elevated, thereby preventing expectations of continued Fed monetary tightening from cooling down noticeably.
U.S. Treasury Yields Remain Elevated; September Rate Hike Bets Near 60%:
The U.S. 10-year Treasury yield climbed toward 4.80% intraday, with the 2-year yield also hovering at elevated levels. Financial markets continue to price in an approximate 59%–60% probability of a 25 bps rate hike at the September FOMC meeting.
Although the New York Fed's survey indicates that medium-to-long-term inflation expectations have not significantly deteriorated despite softening employment outlooks, robust non-farm payrolls combined with surging energy costs keep markets reluctant to unwind hawkish wagers.
Upcoming PPI and CPI to Steer Policy Expectations:
Market focus has shifted decisively toward Thursday's PPI and Friday's CPI releases. With previous labor data underscoring economic resilience, the focal question is whether realized inflation will reignite. Significantly higher producer and consumer price prints will further reinforce rate hike bets; conversely, if core inflation continues to decelerate, the current ~60% hike pricing could swiftly unwind.
2. Technical Analysis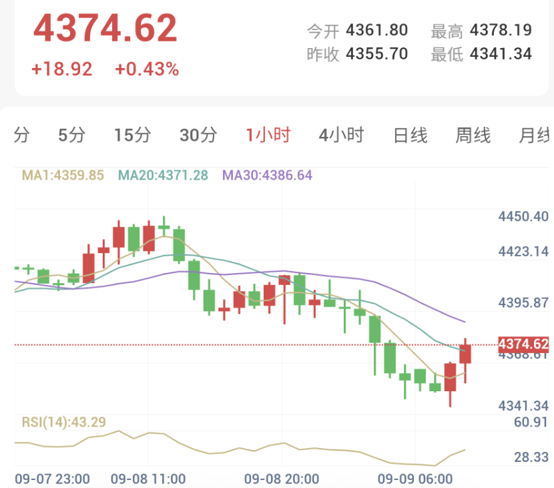
1-Hour Timeframe (Intraday Short-Term: Moving Average Resistance Overhead)
• Trend Assessment: Spot gold is trading near 4,374.62, with an intraday range spanning from 4,341.34 to 4,378.19.
Although prices staged a recovery from the 4,341 trough to reclaim the MA1 and MA20, they remain capped below the MA30.
Structurally, recent swing highs and lows continue to drift downward. The current uptick represents a technical corrective bounce following consecutive drops rather than an established trend reversal.
• Indicator Monitoring: RSI(14) registers at 43.29, lingering below the neutral 50 centerline with weak upside momentum. Initial overhead resistance lies near 4,386, with heavier resistance concentrated in the 4,395–4,400 band.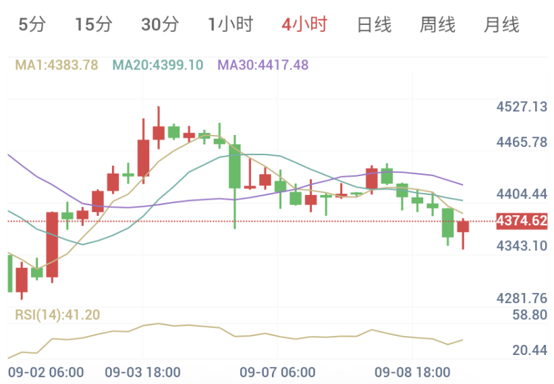
4-Hour Timeframe (Medium-Term Trend: Bearish Dominance / Rebound Has Not Broken Downtrend)
• Trend Assessment: On the 4-hour chart, price action remains situated below all three major moving averages.
Consecutive lower highs have emerged, with prices retreating after failing to sustain levels above 4,400. Moving averages present strong overhead suppression, indicating that the prevailing downward structure has not been repaired.
• Indicator Monitoring: RSI(14) reads 41.20 in neutral-to-weak territory. Given that the 4-hour chart is not deeply oversold, failure to reclaim and hold above 4,400 will keep the short-to-medium-term outlook structurally weak.
3. Trading Execution Plan
Combining the 1-hour and 4-hour structures, the short-term bounce has not dismantled the primary 4-hour bearish trend. Today's operational stance adopts a single strategy of selling on rallies rather than chasing breakdowns near 4,375.
• Strategy Direction: Sell on Rallies
• Trading Signal: Sell
• Confidence Index: 65 / 100
• Entry Reference Level: Near 4,400.00
• Stop Loss Reference: 4,427.25
• Take Profit Target: 4,345.50
• Risk/Reward Ratio: Approx. 1 : 2.00
[Execution Details]
With the market currently hovering near 4,375, sufficient distance remains from the planned entry zone; chasing shorts at current levels is not advised.
The ideal execution rhythm entails awaiting a technical retracement into the 4,395–4,400 region, which aligns with the 4-hour MA20 at 4,399.10 and marks a key breakdown-turned-resistance level.
If price action approaches 4,400 and exhibits a long upper shadow, bearish engulfing candle, inability to print higher highs, or a quick rejection after a brief test of 4,400, it provides structural confirmation for short entries.
Risk Disclaimer
Financial markets involve unpredictable risks, including but not limited to the loss of principal. This analysis is for reference only and does not constitute direct investment advice. Investors should make independent judgments and decisions based on their own risk tolerance.