

Gold Breaks Below Consolidation Midpoint, Weakens to Test Key Support
Market Overview: Upward Momentum Exhausts as Wide Range Oscillation Resumes
• Market Recap: Spot gold has remained confined within a broad oscillation corridor of 4,340.00 - 4,440.00. During the Asian and European sessions, bulls attempted to consolidate support around 4,410.00 to build momentum for an upside breakout. However, persistent buying failed to materialize, and upward drive was ultimately depleted by prolonged sideways trading.
• Intraday Shift: Gold failed to unlock higher ground and met heavy selling pressure at the European-US crossover. Prices sliced straight through the 4,400.00 benchmark to an intraday trough of 4,389.78, postponing immediate breakout expectations and returning the market to wide swings.
Gold Technical Analysis: Moving Average Support Broken, Pullbacks Confirm Overhead Ceilings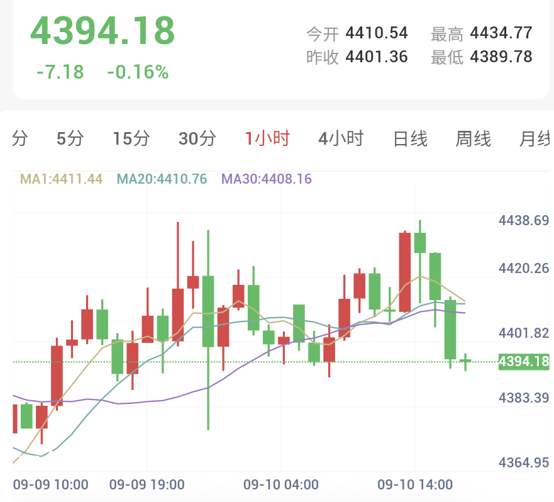
• 1-Hour Structure Weakens: The 1-hour chart printed a solid bearish candle that cleanly broke below the moving average support cluster comprising the MA1 (4,411.44), MA20 (4,410.76), and MA30 (4,408.16). Trading near 4,394.18, short-term averages have transitioned from support into overhead resistance, leaving the immediate structure visibly weakened.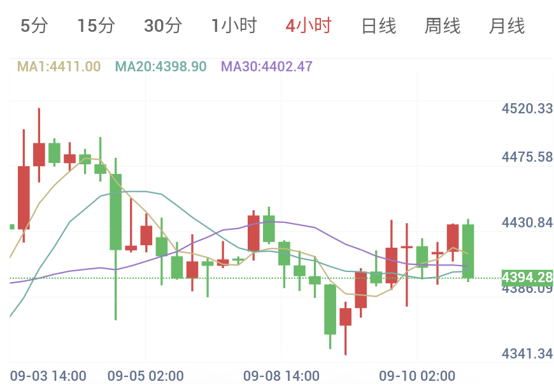
• 4-Hour Pullback Under Pressure: On the 4-hour chart, after reaching a session high of 4,434.77, price action displayed clear rejection and fell back below the 4-hour MA20 (4,398.90) and MA30 (4,402.47). The chart failed to expand upward, instead maintaining a narrowing range consolidation.
• Key Pivot Levels: Overhead resistance has shifted down to the breakdown zone at 4,408.00 - 4,411.00, with stronger resistance at the daily high zone of 4,434.00 - 4,442.00. Downside support sits at 4,388.00 - 4,390.00; a sustained break below this band targets the lower boundary of the broader range at 4,355.00 - 4,365.00.
Intraday US Session Strategy: Follow the Breakdown with Shorts, Buy Only on Confirmed Dips
• Short on Pullback (Primary Stance): With the 1-hour chart losing midpoint support and moving averages turning into resistance, blind dip-buying at current levels is discouraged. If prices retrace to test 4,405.00 - 4,410.00 and face rejection, initiate short positions with stops above 4,415.00. Initial targets aim at 4,388.00, with further extensions toward 4,365.00 upon a break.
• Deep Rebound Buy (Contingency Stance): If the market accelerates lower and breaches 4,388.00, avoid chasing shorts at lows. Wait patiently for prices to probe the lower boundary at 4,355.00 - 4,365.00. Should stabilization signals such as long lower wicks appear, stage long entries with stops below 4,345.00, targeting 4,388.00 - 4,400.00.
Risk Disclaimer
Financial markets carry unpredictable risks, including the loss of principal. This analysis is for reference only and does not constitute direct investment advice. Investors should make independent judgments and trade in accordance with their own risk tolerance.