

I. Market News Analysis: Strong Economic Data and Heightened Fed Hawkish Expectations
The US September Services PMI rose to a near five-year high, while the Manufacturing PMI hit a more than four-year high. Strong economic data indicates robust US demand and persistent inflation risks, prompting markets to view the September rate hike as the start of a new tightening cycle rather than a one-off adjustment, with interest rate futures pricing a significantly higher probability of another hike in December.
The 10-year US Treasury yield remained near a high of 5.0%, and the US dollar index climbed to around 100.79, hitting a two-month high, significantly raising the holding costs for non-interest-bearing precious metals. The dollar index rose for the fourth consecutive session to a two-month high; broad dollar strength increased costs for non-dollar holders of gold, while 10-year yields trading near 5.0% slowed gold ETF inflows.
Domestic gold jewelry prices collectively fell below the 1300 yuan/gram mark, accumulating a drop of over 100 yuan within a week from August highs, alongside a sharp correction in domestic precious metal equities. Affected by the sharp pullback in international gold prices, brands like Chow Tai Fook, Chow Sang Sang, and Lao Feng Xiang lowered retail gold jewelry quotes by 11 to 17 yuan/gram on September 24: Chow Tai Fook quoted 1299 yuan/gram, Lao Feng Xiang 1300 yuan/gram, and Chow Sang Sang 1297 yuan/gram, dropping about 100 yuan from peaks above 1310 yuan on August 25. A-share precious metal sectors turned from gains to losses on the morning of September 24, with both gold stock ETFs and gold ETFs pulling back as market sentiment turned cautious.
II. Gold Technical Analysis: Daily Bullish Trend Intact, Short-Term Bearish Bias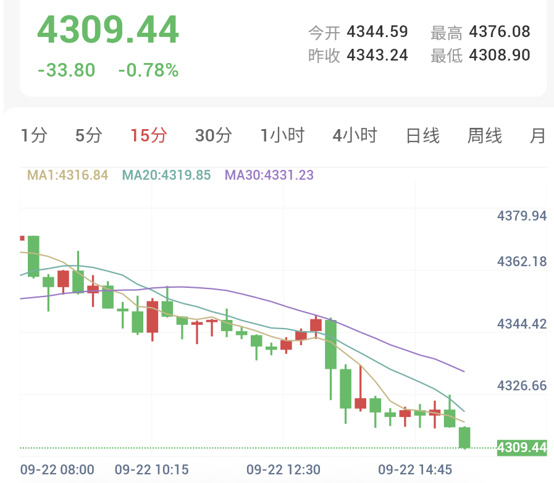
Daily Level: Asian session opened at $4,287.59/oz, moving narrowly lower intraday with a high of $4,303.33 and a low of $4,262.50, currently trading near $4,267.58/oz, down 0.45% intraday. Moving averages remain in a golden cross state, maintaining a bullish macro outlook. Prices are currently between the 20 and 80 moving averages, awaiting a breakout above the daily 20 moving average to initiate long positions. Strong support lies near $4,260.00, requiring close attention to whether prices can stabilize at this level.
Intraday Short-Term (15-Minute): Moving averages present a bearish alignment, with prices operating below the 20-period moving average at $4,276.19. Short positions can be entered near $4,276.19 where morning prices broke below the 20 MA with a confirming candlestick, referencing the upper high of $4,303.33 for stop-loss and exiting at a 2:1 risk-reward ratio. Current price is near $4,267.58; if a pullback toward $4,276.00 encounters resistance, short positions can be continued, while a breakout above $4,285.00 warrants exiting shorts to watch from the sidelines.
III. Silver Technical Analysis: Bearish Momentum Dominates, Focus on Key Moving Average Support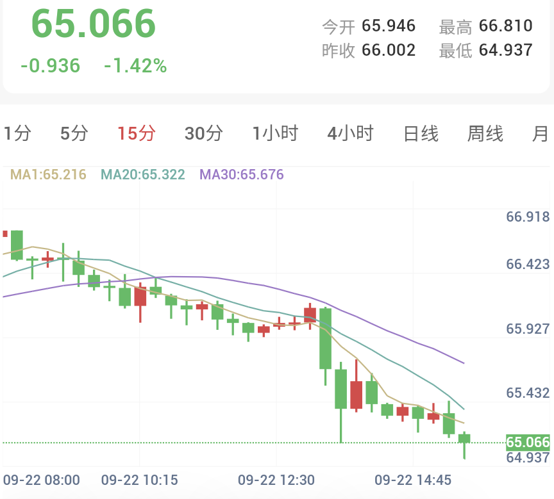
Daily Level: Spot silver opened at $64.291/oz today, trading in a narrow range with bearish momentum prevailing, touching a session high of $64.612 and a low of $63.449, currently trading around $63.727/oz, down 1.02% intraday. The daily moving averages show a golden cross with a bullish bias, having previously broken above the daily 20 moving average. The $66.246 area can be considered as a reference entry level for medium-term long positions, with stop-loss referenced at the lower low of $62.300. However, with prices pulling back to $63.727, traders should wait for prices to re-stabilize above the 20 moving average before considering medium-term long entries.
Intraday Short-Term (15-Minute): Moving averages display a bearish alignment, trading below the 20-period moving average of $64.005. Morning prices breaking below the 20 MA near $64.005 offer a suitable entry point for shorts, with stop-loss referenced at the upper high of $64.612 and a 2:1 risk-reward exit. Current price is around $63.727; if a pullback to $64.000 meets resistance, short positions can be maintained, while breaking above $64.20 prompts exiting shorts to observe.
IV. Risk Warning
Trading markets involve unpredictable risks, including but not limited to principal loss. This analysis is for reference only and does not constitute direct investment advice. Investors should make independent judgments and autonomous decisions based on their own risk tolerance.
Precious Metals Plunge Under Pressure as Strong Economic Data Meets Hawkish Stance
Published: 2026-09-24 17:11:03