

I. Market Overview: Fed Maintains Hawkish Stance, End-of-Quarter Rebalancing Accelerates Shakeout
Spot gold faced concentrated selling pressure at Monday's open. Federal Reserve officials continued to signal high interest rates, coupled with resilient US economic data, keeping the dollar index and Treasury yields elevated. With institutions rebalancing positions at the end of the third quarter, the overall market maintained a cautious defensive posture ahead of the Dallas Fed manufacturing index and this week's non-farm payrolls report.
Bearish momentum was released intensively on the charts, with prices accelerating downward after breaking the 4245.00 - 4255.00 support zone, pulling back nearly $100 from highs to touch an intraday low of 4113.19. Prices have now entered the core macro demand zone of 4145.00 - 4160.00, where extreme downside momentum has moderated and bargain-hunting buying interest is gradually building a defense.
II. Technical Analysis: Macro Downtrend Intact, Short-Term Rebound Structure Emerges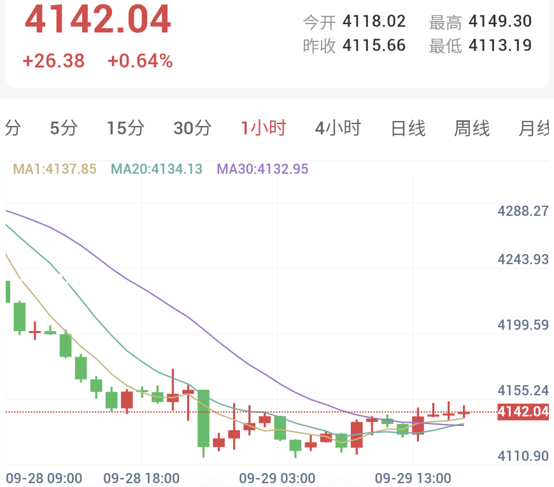
On the 1-hour chart, gold remains constrained by the descending trendline originating from the 4399.83 high. However, following a sharp sell-off, gold found a floor and stabilized at 4113.19, trading last at 4142.04—having reclaimed positions above the dense 1-hour moving average cluster to carve out a short-term oversold rebound repair pattern.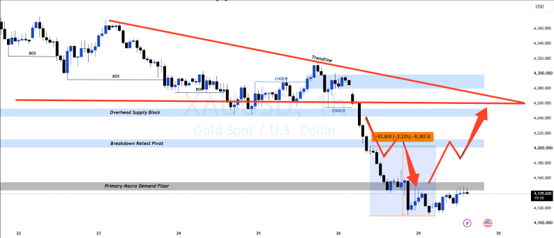
Path Projection: The market is currently undergoing technical repair. The initial phase expects an upward test toward the prior breakdown-to-support conversion zone of 4200.00 - 4212.00. Should resistance trigger a pullback, a secondary retest of 4180.00 - 4190.00 will follow; once downside support is confirmed solid, prices are positioned to push further upward toward the overhead supply zone of 4242.00 - 4255.00 and descending trendline resistance.
III. Key Price Levels
Major Strong Resistance: 4399.83
Descending Trendline Resistance: 4270.00 - 4285.00
Overhead Resistance Zone: 4242.00 - 4255.00
Breakdown Conversion Level: 4200.00 - 4212.00
Short-Term Support Band: 4132.00 - 4137.00
Bottom Defense Line: 4145.00 - 4160.00 (Intraday Extreme Low: 4113.19)
IV. Trading Plan
1. Short on Pullback Resistance (Trend-Following Strategy): If prices bounce to the 4200.00 - 4212.00 breakdown conversion zone and encounter resistance, accompanied by long upper shadows or bearish engulfing signals on 5-minute or 15-minute charts, initiate short positions. Set stop-loss above 4220.00, targeting 4185.00 down to the 4145.00 - 4160.00 core demand zone upon a breakdown.
2. Long on Moving Average Support (Rebound Strategy): Given that prices have reclaimed the 4132.00 - 4137.00 moving average band, light long positions can be taken if pullbacks stabilize without breaking. Set strict stop-loss below 4113.00, targeting 4185.00 followed by 4200.00 - 4212.00 sequentially.
3. Bearish Defense and Invalidation: If a 1-hour candle body closes solidly above 4260.00, it indicates that short-term downside continuation momentum has failed. Shorts should exit and step aside as the market prepares for a more substantial technical rebound toward 4280.00.
There is no disorderly breaching of core supports visible in the market. Blindly looking for a drop to 4000.00 at this stage lacks sufficient basis. Operations should prioritize precise pivot trading following key level confirmations, avoiding chasing rallies or selling dips in intermediate consolidation zones.
V. Risk Warning
Trading markets involve unpredictable risks, including but not limited to principal loss. This analysis is for reference only and does not constitute direct investment advice. Investors should make independent judgments and autonomous decisions based on their own risk tolerance.
Gold Prices Rebound Into Repair, Awaiting Pullback Resistance to Determine Direction
Published: 2026-09-29 17:07:32