

I. Fundamental Analysis
The primary pressure on gold overnight stemmed from surging US Treasury yields and rate hike expectations. Spot gold plummeted nearly 4% intraday, touching an intraday low near $4,111—its lowest level since August 5. The US 10-year Treasury yield surged to 5.27%, its highest since 2007, while the 30-year yield climbed to approximately 5.55%, returning to multi-year highs not seen since 2004.
Concurrently, the US Dollar Index hovered near two-month highs, with markets pricing in roughly a 70% probability of another Fed rate hike in October. Silver, platinum, and palladium also experienced synchronized sharp declines, indicating that current pressure is not isolated to gold alone, but rather a broad-based suppression of the precious metals sector by elevated yields and a strong greenback.
Middle East tensions remain perilous. Following President Trump's rejection of Iran's prior seven-day proposal, Qatari mediators engaged separately with US and Iranian officials, causing energy prices to pull back from session highs, though both sides have yet to establish a ceasefire or an agreement to reopen the Strait of Hormuz.
On the other hand, Kpler data showed that September exports from major Middle Eastern producers rebounded to 12.8 million barrels per day, with Hormuz-bound exports recovering to approximately 7.4 million barrels per day, partially easing supply concerns.
Today's trading focus shifts toward upcoming US economic data and the Federal Reserve. The US will release the August JOLTS job openings tonight, followed by August PCE on Wednesday, September ISM manufacturing PMI on Thursday, and the September non-farm payrolls report on Friday.
II. Periodic Technical Analysis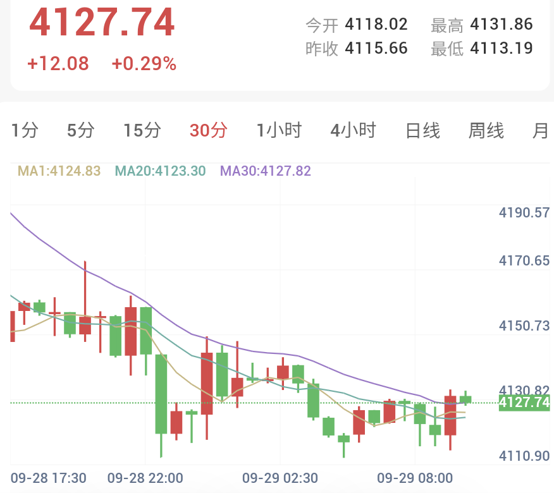
30-Minute Timeframe (Intraday Short-Term: Weak Recovery Following Sharp Overselling): Gold is currently trading around 4127.74, with an intraday high of 4131.86 and a low of 4113.19. Prices have reclaimed MA1 at 4124.83 and MA20 at 4123.30, but remain engaged in choppy battles near MA30 at 4127.82.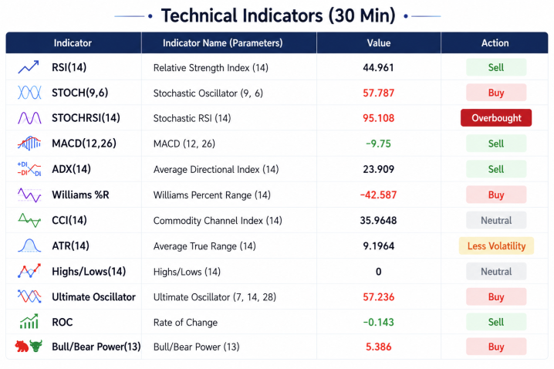
30-minute technical indicators read Neutral overall, split evenly with 4 Buy and 4 Sell signals. RSI(14) prints 44.96, remaining below the 50 midline; MACD reads -9.75, indicating that prior downside momentum has not fully dissipated. However, StochRSI has climbed to 95.11, signaling that the short-term rebound initiated near 4113 has grown somewhat overheated, representing a technical correction following a precipitous drop.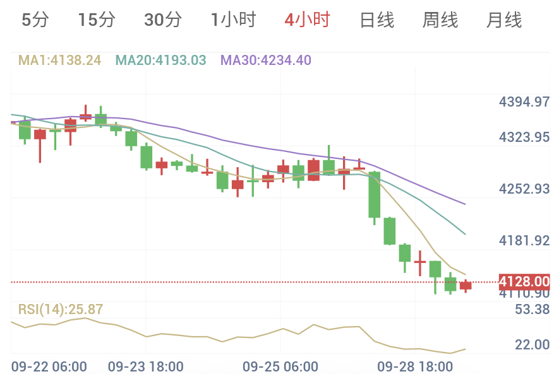
4-Hour Timeframe (Medium-Term Structure: Bearish Trend, but Distinctly Oversold): Prices on the 4-hour chart remain significantly below MA1 at 4138.24, MA20 at 4193.03, and MA30 at 4234.40. The three moving averages have formed a clear bearish alignment, and following consecutive declines from above 4280 down toward 4110 over recent sessions, the structural downward trend on the 4-hour chart remains unchanged. However, RSI(14) has dropped to 25.87, officially entering oversold territory, indicating that the overarching bias remains short.
III. Trading Execution Plan
While fundamentals and the 4-hour structure remain clearly bearish, gold has experienced consecutive rapid declines, pushing the 4-hour RSI into oversold territory. Consequently, the most important priority today is to avoid chasing shorts blindly within the 4110–4130 zone.
A more rational approach remains: Wait for a rebound before assessing short entry opportunities.
Strategy Direction: Sell after rebound failure
Trading Signal: Sell (Conditional Trigger)
Confidence Index: 75 / 100
Core Observation Range: 4110—4193
First Resistance: 4138—4151
Core Resistance: 4170—4193
Initial Downside Support: 4110—4113
Key Psychological Support: 4100
[Execution Details]
If gold continues to rebound from near 4110, first focus on 4138–4151. This represents only the initial barrier; if 30-minute momentum remains strong, do not rush into direct shorting.
Of greater importance is the 4170–4193 zone. If gold rebounds into this range and prints long upper shadows, bearish engulfing patterns, fails to lift reaction highs, or sees 30-minute MACD turn negative again, traders can re-engage short positions.
Conversely, if prices decisively stabilize above 4193, it would signal that a more substantial oversold correction is unfolding on the 4-hour chart, significantly reducing short-term bearish dominance and requiring traders to pivot focus toward the 4230 region rather than mechanically continuing to short.
US Treasury Yields Hit Near 20-Year Highs as Precious Metals Plummet (2026/09/29)
Published: 2026-09-29 09:53:20