

I. Market Overview: Macro Downtrend Intact, Short-Term Oversold Rebound Channel Emerges
The Federal Reserve maintains a hawkish bias, while Treasury yields and the US dollar index remain elevated, continuing to exert macro pressure on gold.
From a macro perspective, following the breakdown from prior highs, gold remains in a bearish repricing structure. Only a decisive recovery of the key 4450.00 - 4550.00 zone can establish a true bullish reversal; until then, every mid-to-long-term rebound carries the risk of renewed bearish absorption.
Short-Term Market Characteristics: Despite macro pressure, following the stabilization from lows, the market has formed a clear short-term ascending channel. Latest prices trade near 4198.76, hitting an intraday high of 4202.77, as prices test the channel's upper band resistance at 4200.00 - 4215.00.
II. Technical Analysis: Upper Channel Band Faces Directional Choice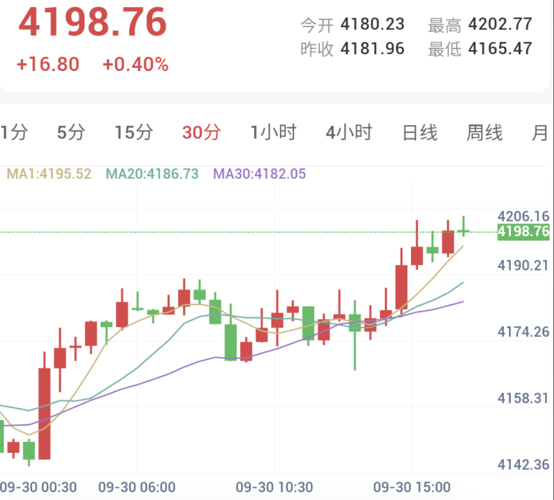
Minor Moving Average Support: The 30-minute chart shows MA1 (4195.52), MA20 (4186.73), and MA30 (4182.05) aligned upward, indicating that short-term rebound momentum is not yet exhausted. However, prices are extremely close to the channel's upper band resistance zone, making direct chasing unfavorable in terms of risk-reward ratio.
Short-Term Path Projections:
Upside Breakout Scenario: If bulls decisively break above 4215.00 on a closing basis intraday, short-term rebound space will open further, with extended targets at 4240.00 and the prior breakdown supply zone at 4245.00 - 4255.00.
Pullback Pressure Scenario: If prices encounter sustained pressure at 4200.00 - 4215.00 and pull back, a technical correction will unfold, looking back toward the channel midline and dense support at 4175.00 - 4180.00.
III. Key Price Levels
Major Strong Resistance: 4450.00 - 4520.00
Overhead Supply Pressure Zone: 4240.00 - 4255.00
Immediate Channel Upper Resistance: 4200.00 - 4215.00 (Intraday High: 4202.77)
Short-Term Pullback Support Band: 4175.00 - 4182.00 (Channel Midline and 30-Min MA)
Intraday Lower Edge Critical Defense: 4165.00 (Intraday Low: 4165.47)
Major Liquidity Accumulation Zone: 3850.00 - 3950.00
IV. Trading Plan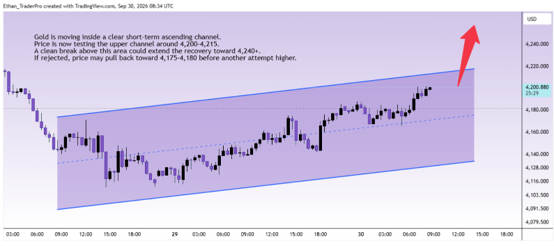
1. Buy on Pullback Stabilization (Trend-Following Strategy): If prices pull back after encountering resistance at 4200.00 - 4215.00, monitor for stabilization signals in the 4175.00 - 4182.00 zone. If pullbacks hold without breaking and feature long lower shadows, light long positions can be initiated, with stop-loss set below 4165.00, targeting 4200.00 - 4215.00, and extending toward 4240.00 upon a breakout.
2. Test Shorts at Upper Band Resistance (Short-Term Tactical Strategy): If prices repeatedly test 4200.00 - 4215.00 without success and display long upper shadows or bearish engulfing patterns on 5-minute or 15-minute charts, light short positions can be probed, with stop-loss strictly set above 4220.00, targeting 4180.00.
3. Follow Breakouts with Longs: If the 1-hour chart closes decisively above 4215.00, bearish pressure-testing ideas are suspended. Traders can follow the trend by going long utilizing converted support at 4210.00 - 4215.00, targeting a rebound extension to 4240.00.
V. Risk Warning
Trading markets involve unpredictable risks, including but not limited to principal loss. This analysis is for reference only and does not constitute direct investment advice. Investors should make independent judgments and autonomous decisions based on their own risk tolerance.
Short-Term Rebound Tests Upper Band While Macro Downtrend Maintains Suppression
Published: 2026-09-30 16:49:34