

I. Fundamental Analysis
1.
According to the Associated Press, the US is deploying approximately 9,000 additional troops to the Middle East, with a third carrier strike group also heading to the region. Trump previously warned of potential further military action against Iran.
Meanwhile, Marisks reported that three oil tankers were struck by unidentified projectiles while navigating the Strait of Hormuz, reigniting maritime security risks.
The US Department of Treasury announced a new round of sanctions on Thursday targeting Iran's railway, automotive, manufacturing, and steel-related networks, demonstrating that Washington's military and economic pressure remains unabated.
2.
Concurrently, internal divisions among Federal Reserve officials regarding their next steps have widened.
Vice Chair Jefferson emphasized that future adjustments require more data and there is no need to rush the next decision;
Kashkari still expects further rate hikes this year and in 2027, though he lacks a clear inclination on October action;
Dallas Fed President Logan leaned noticeably hawkish, believing interest rates may need to rise by a cumulative 50 bps or more. The current division centers primarily on the timing and magnitude of rate hikes.
3.
On the other hand, August core PCE rose by only 3.0% year-on-year, coming in below market expectations of 3.3% and significantly lowering market pricing for another rate hike in October. Spot gold found temporary support as a result on Thursday, settling around $4,177. However, with the dollar remaining strong and energy prices elevated, gold's rebound momentum was limited, pulling back toward $4,146 in early Asian trading.
The true focal point today is the US September non-farm payrolls report released tonight. Markets widely expect job growth to come in significantly below August's 162k; if data prints soft again, it could further dent October rate hike expectations, while stronger prints would likely re-propel the dollar and Treasury yields.
II. Periodic Technical Analysis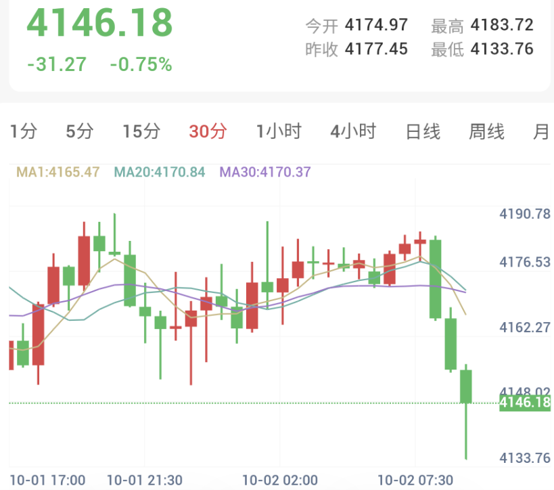
30-Minute Timeframe (Intraday Short-Term: Clearly Bearish, Nearing Oversold):
Gold currently trades around 4146.18, with an intraday high of 4183.72 and a low of 4133.76.
Prices have broken below MA1 (4165.47), MA20 (4170.84), and MA30 (4170.37). Following a swift consecutive decline from near 4180 during the early session, two prominent bearish candles pierced 4160, shifting the short-term structure back to bearish.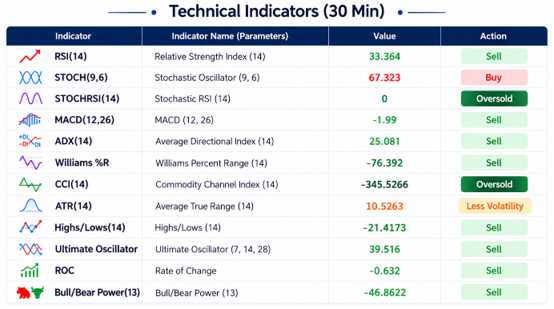
30-minute technical indicators universally print a Strong Sell, with 8 indicators flashing Sell and only 1 Buy.
RSI(14) has dropped to 33.36, MACD registers -1.99, and ADX reaches 25.08, indicating short-term bearish dominance.
However, StochRSI has fallen to 0, and CCI registers -345.53, both entering clearly oversold territory.
Thus, the current picture is clear:
The trend remains bearish, but current levels are no longer suitable for chasing shorts further.
Initial overhead resistance is watched at 4162—4171, with further resistance at 4176—4184.
Initial downside focus rests on today's low of 4133—4145, with deeper support at 4110—4120.
III. Trading Execution Plan
The overarching macro structure remains bearish, but gold has arrived at the vital lower liquidity zone of 4130—4145, while 30-minute indicators are visibly oversold.
Consequently, today's focus is not to chase shorts blindly near 4140, but rather to wait for prices to enter truly advantageous positioning.
Strategy Direction: Sell after rebound failure
Trading Signal: Sell (Conditional Trigger)
Confidence Index: 65 / 100
Core Observation Range: 4130—4220
Short-Term Resistance: 4176—4184
Core Resistance: 4210—4220
Key Downside Region: 4130—4145
Core Support: 4110—4120
[Execution Details]
The primary plan remains waiting for gold to mount an upward rebound.
If prices bounce back toward 4208—4218 and display long upper shadows, bearish engulfing patterns, failed rallies, or form a renewed downward structure on lower timeframes, shorting opportunities can be monitored.
Set reference stop-loss above 4230, targeting 4180 initially, followed by 4145, with extended targets at 4115—4120.
However, because prices are already approaching 4130—4145, another critical scenario exists:
If gold first sweeps downward through 4130—4145, rapidly recovers, and establishes a clear lower-timeframe bullish structural shift, the direct downside rhythm could be temporarily interrupted, potentially retesting 4180 or even 4210—4220 in the short term.
Conversely, if the H1 chart closes effectively below 4130, it indicates that lower liquidity has failed to provide solid support, significantly increasing the probability of testing 4110—4120.
Furthermore, tonight's NFP report outweighs technical formations. If employment prints significantly weaker than expected, the current oversold status can easily translate into short-covering; if employment and wages print strong again, the dollar, Treasury yields, and rate hike expectations may once again jointly suppress gold.
IV. Risk Warning
Trading markets involve unpredictable risks, including but not limited to principal loss. This analysis is for reference only and does not constitute direct investment advice. Investors should make independent judgments and autonomous decisions based on their own risk tolerance.
US Deploys Troops to Middle East Amid Widening Fed Division as Markets Await NFP
Published: 2026-10-02 09:46:45