

I. Market Overview: Dip-Buying Emerges After Sharp Drop
Price Action Characteristics:
London gold experienced a sharp intraday drop, probing a low of $4,066.77 before stabilizing.
The candlestick printed a prominent lower shadow, reflecting responsive buying absorption off the session lows.
Quotes currently trade around $4,085.68; while bears retain absolute near-term control, chasing short positions at current bottom levels entails high risk. The preferred tactical stance favors anticipating a technical bounce first, followed by looking for short entries once upward momentum stalls.
II. Technical Analysis: Bearish Moving Average Alignment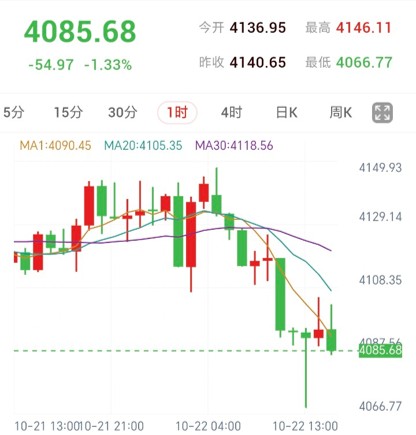
Moving Average Resistance:
The 1-hour chart displays a classic bearish divergence across the moving average matrix (MA1: $4,090.45, MA20: $4,105.35, MA30: $4,118.56).
Price currently trades completely beneath all three moving averages, meaning any recovery must first reclaim MA1 before challenging the core overhead pressure of MA20.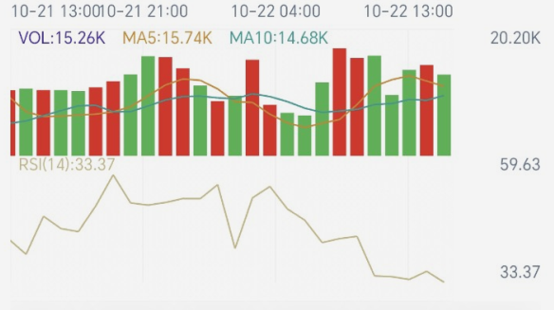
Momentum Divergence and Exhaustion:
RSI(14) registers at 33.37, closely approaching the 30 oversold threshold.
This indicates that bearish momentum has temporarily exhausted. Combined with the long lower shadow, it points to a strong technical need for a corrective rebound. Traders should wait for the rebound momentum to release completely before positioning.
III. Key Levels at a Glance
Core Resistance Zone: $4,090.45 - $4,105.35 (MA1 to MA20 pressure zone)
Bull/Bear Pivot Line: $4,105.35 (MA20; holding above eases near-term weakness)
Major Resistance: $4,118.56 (MA30)
Downside Support: $4,066.77 (Intraday low/bottom of the long lower shadow)
IV. Trading Execution Plan
Current market dynamics advise against chasing shorts directly at the bottom. Strictly follow a right-side execution logic: 'wait for the rebound, verify resistance, then enter.'
🔻 Moving Average Rejection Short (SELL):
Focus Zone: $4,090.45 - $4,105.35
Trigger Conditions: Price bounces into this zone and shows clear upside stalling, a 1-hour candle closes back below $4,090.45, and subsequent retests fail to reclaim the level.
Target Levels: Target the intraday low of $4,066.77 (closely assess buying absorption as price nears this floor to lock in profits).
Stop-Loss Reference: Positioned strictly above the swing high established by the confirmed rejection structure.
🚫 Strategy Invalidation Condition:
If a 1-hour candle body breaks decisively above $4,105.35 (MA20) and sustains support on a retest, the short thesis is immediately invalidated. Cancel the short plan; upside scope will open toward $4,118.56.
V. Risk Warning
Extended lower shadows frequently precipitate sharp whipsaw bounces. Ensure trades are executed only after hourly candle closes confirm rejection, and refrain from chasing sales at daily lows.
This analysis is provided for market reference only. Investors must make independent decisions aligned with their risk tolerance.
Gold Rebound Faces Resistance, Look to Enter Trend-Following Shorts
Published: 2026-10-22 16:22:20