

Analyst: Ma Guobang
Today's tactical approach maintains a bias toward fading technical rebounds upon confirmed resistance rejection.
In morning trade, London gold quoted at $4,019.09 per ounce, down $5.22 or 0.13% from the previous close.
The session opened at $4,031.28, printing an intraday high of $4,032.67 against a trough of $4,011.79.
I. Fundamental Analysis: Disputed Tanker Attacks and EU Pressure on Houthis Keep Energy Risks in Focus
Geopolitically, Iran's Islamic Revolutionary Guard Corps claimed on October 22 that seven tankers sustained damage in the Strait of Hormuz, which Donald Trump subsequently denied regarding allegations of direct strikes and naval mines.
On the same day, the European Parliament passed a resolution urging the European Council to designate Yemen's Houthi movement as a terrorist organization, freeze affiliated assets, and reinforce escort capabilities within the Red Sea mission; the formal listing still requires unanimous approval from EU member states.
Contrasting narratives between Washington and Tehran alongside persistent navigation risks keep maritime transit vulnerabilities at the forefront of financial markets.
Should transit hazards drive up fuel and freight costs further, renewed inflation pressures could constrain major central banks from expanding monetary easing.
II. 1-Hour Technical Analysis: Descending Moving Averages Cap Price as RSI Probes Oversold Boundary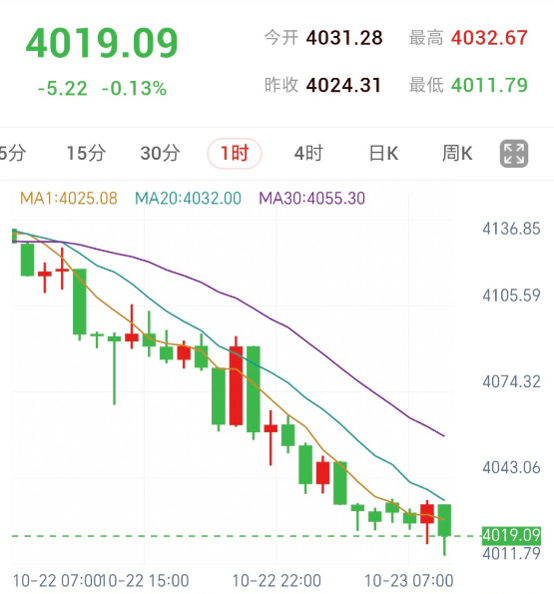
From the 1-hour chart perspective, recent price action displays a steady sequence of lower highs and lower lows, accompanied by a bearish moving average alignment:
MA1 stands at $4,025.08
MA20 stands at $4,032.00
MA30 stands at $4,055.30
With all three moving averages sloping overhead, the broader short-term structure remains tilted to the downside.
Regarding momentum indicators, RSI(14) registers at 30.82, closely probing the 30 oversold benchmark and indicating that a corrective bounce could emerge at any time.
Accordingly, initial attention centers on the $4,025.08–$4,032.67 resistance zone, which encompasses MA1, MA20, and the session high.
Given potential oversold mean-reversion, entry execution requires waiting for price to bounce into resistance and confirm renewed structural exhaustion.
III. Intraday Trading Execution Plan
Strategy Direction: Monitor trend-following short opportunities upon confirmed rejection within resistance
Focus Zone: $4,025.08—$4,032.67
Trigger Conditions: Price bounces into the zone, faces clear upward exhaustion, and a 1-hour candle closes back beneath $4,025.08; enter only after a subsequent retest confirms overhead resistance holds
Target Levels: Initial target at the session low of $4,011.79
Invalidation Condition: A 1-hour candle closes above $4,032.67 and subsequently defends that level on a retest, canceling the fade-the-rebound short plan
Stop-Loss Reference: Positioned strictly above the confirmed swing high established during the rejection structure
[Execution Details]
If price breaks directly beneath $4,011.79 without a prior rebound, wait for a new structural pattern to form rather than chasing the breakdown impulsively.
IV. Risk Warning
Breaking Middle East geopolitical headlines can heighten intraday volatility; traders must exercise strict risk limits per trade and adhere to verified stop-loss parameters.
(Compiled and Edited by Lucky Gold Global Limited)
Gold Downside Extends, Awaiting Pullback Rejection Confirmation
Published: 2026-10-23 09:47:31