

US-Iran Clashes Intensify as Falling Treasury Yields Spark V-Shaped Gold Surge
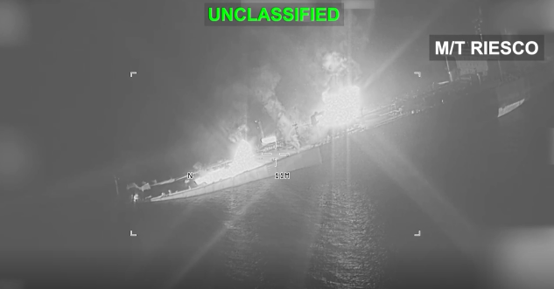
1. News & Geopolitical Events: US-Iran Clashes Escalate Dramatically as US Imposes Harsh Aviation Sanctions
On Wednesday, Middle East hostilities marked their most severe direct military escalation in six months, while Washington opened a sweeping new sanctions front:
• Total US Blockade on Iran's Aviation Sector: The US Treasury Department issued 36 new sanctions targeting Iran's aviation sector and affiliated entities. Beyond grounding Mahan Air, the measures extend to global intermediaries providing spare parts, cargo handling, and transit services across Turkey, the UAE, and Malaysia. The US also suspended overflight authorizations for non-US airlines crossing Iranian airspace, aiming to sever Tehran's commercial aviation and financial connections.
• Direct Naval Battles and Missile Strikes on Bases: US Central Command confirmed that American forces destroyed five Iranian commercial energy vessels in response to prior ballistic missile strikes on US warships. Iran's Islamic Revolutionary Guard Corps retaliated by launching 20 ballistic missiles at a US base in Jordan (with Jordan reporting 18 intercepted) and claimed strikes against 10 vessels within its declared Strait of Hormuz exclusion zone, including two US ships and eight tankers.
• Physical Chokepoints Push Energy Near $100: Physical shipping disruptions in the Strait of Hormuz, combined with Houthi strikes on southern Saudi Arabian energy facilities (injuring 73 and sparking fires), drove Brent crude prices toward the $100 psychological threshold.
2. 30-Minute Candlestick Chart Analysis: Sharp Rebound from 4,341 Reclaims Moving Averages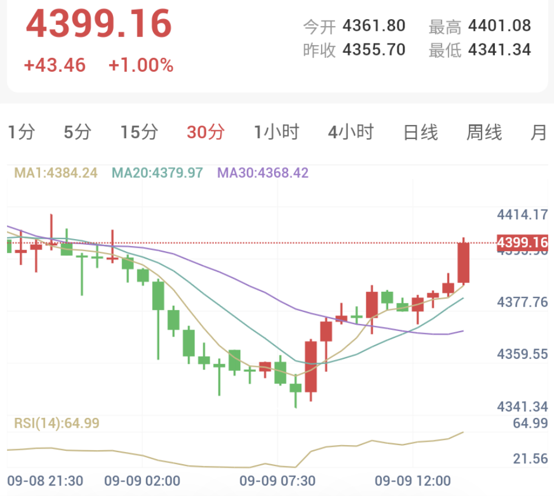
As of 14:02 Beijing time, spot gold traded at $4,399.16/oz, up 1.00% (+$43.46) on heavy volume, pressing decisively against the $4,400 psychological resistance.
Early in the session, gold faced downward momentum from persistent energy-driven inflation expectations, sliding to an intraday trough of $4,341.34. However, as news of direct naval confrontations spread, Asian equity markets tumbled, triggering aggressive flight-to-safety inflows that provided powerful structural support for bullion.
3. 30-Minute Technical Indicators: Trend Metrics Flash Universal Buy Signals Amid Overbought Readings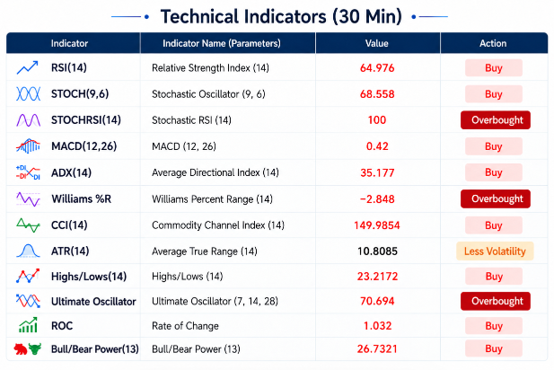
Following an intraday surge of nearly $60, the 30-minute technical indicator composite shifted rapidly from extreme weakness to an overwhelming "Strong Buy" (8 buy, 0 neutral, 0 sell). Bullish momentum expanded sharply, pushing short-term oscillators into overbought zones:
• Trend and Momentum Indicators Turn Bullish: The RSI(14) climbed to 64.97, maintaining a firm bullish trajectory. The MACD(12,26) printed at 0.42, crossing above the zero line with an active buy signal. The ADX(14) recorded 35.17, confirming a coherent trend supported by institutional capital. The CCI(14) reached 149.98, and Bull/Bear Power registered 26.73, indicating decisive buyer dominance.
4. Summary
A notable market divergence unfolded today: while crude surged toward $100—a development that typically fuels Fed rate hike fears and pressures non-yielding bullion—gold rebounded nearly $60 from its $4,341 low.
The direct naval escalation triggered panic liquidation across Asian equities and global risk assets. Capital fleeing equities sought refuge in US Treasuries, driving medium-to-long-term yields sharply lower.
The sudden decline in Treasury yields offset rate-hike concerns and lowered the opportunity cost of holding bullion, acting as the primary catalyst behind gold's swift V-shaped recovery.