

Houthi Forces Choke Bab el-Mandeb as Gold Mounts Aggressive V-Shaped Rebound off $4,300
1. News & Geopolitical Events
Between Thursday and Friday, Yemen's Houthi forces launched a rapid offensive to seize control of the southwestern port of Mokha, significantly strengthening their operational dominance over the Bab el-Mandeb strait.
According to US media reports, this coastal push along the Red Sea was executed under direct guidance from Tehran to establish a new operational front. With the Strait of Hormuz already restricted, transit disruption across Bab el-Mandeb tightens the chokehold on the global energy supply chain.
Regional and Iranian sources indicated that directives were issued to expand strikes against US allies alongside commitments of funding and weapons, with senior personnel deployed to oversee tactical operations.
Meanwhile, Yemeni government forces requested expanded close air support from Saudi Arabia to regain coastal control. However, concerned over potential retaliatory drone attacks on its own territory, Saudi air operations remained confined to peripheral northern axes, leaving the outlook for restoring strait access uncertain.
2. 30-Minute Candlestick Chart Analysis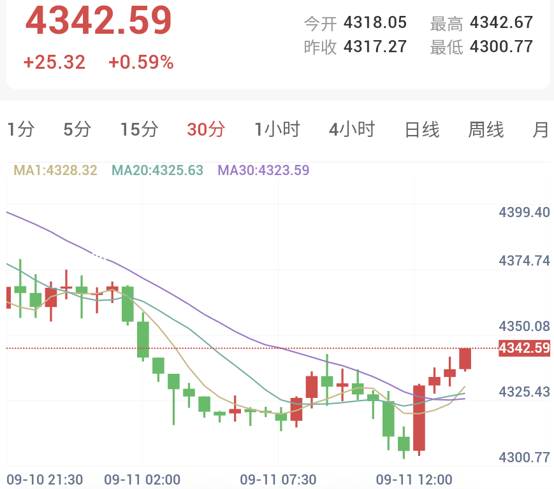
As of 13:45 Beijing time, spot gold traded at $4,342.59/oz, up 0.59% (+$25.32) intraday.
During the Asian morning session, gold extended prior downward momentum as selling pressure pushed prices lower in a stepped pattern, probing near the $4,300 psychological boundary to print an intraday low of $4,300.77 around midday.
Upon testing $4,300.77, selling pressure experienced exhaustion, triggering an influx of technical dip-buying. Consecutive full-bodied bullish candles drove a steep vertical rally, erasing morning losses to reach an interim high of $4,342.67.
Across moving averages, the sharp price ascent allowed candles to slice upward through short-term moving average resistance. The MA1 ($4,328.32), MA20 ($4,325.63), and MA30 ($4,323.59) were reclaimed, converting prior overhead resistance into an active dynamic support zone.
3. 30-Minute Technical Indicators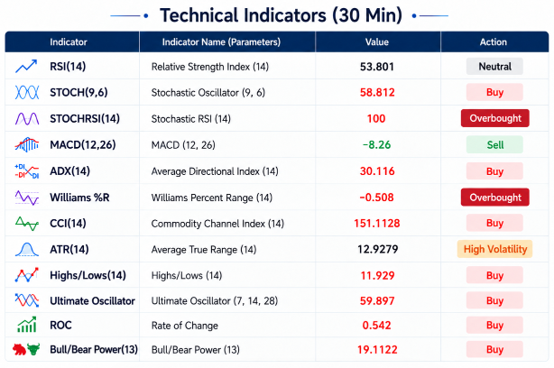
Following an intraday surge exceeding $40, the 30-minute technical composite shifted rapidly from weakness to an overwhelming "Strong Buy" (7 buy, 1 neutral, 1 sell). Bullish momentum expanded sharply, pushing sensitive indicators into extreme overbought territory:
• Trend and Momentum Indicators Turn Decisively Bullish: The Commodity Channel Index CCI(14) surged to 151.11, issuing strong buy signals. The trend strength ADX(14) recorded 30.11 with a buy indication, confirming coherent momentum behind the bounce. The MACD(12,26) registered at -8.26; while still below zero with a sell tag, downside momentum has diminished noticeably.
• Core Oscillators Recover to Neutral-Bullish Bands: The Relative Strength Index RSI(14) climbed to 53.80, exiting oversold territory and returning to the neutral-to-bullish median zone.
• Sensitive Oscillators Hit Historical Overbought Extremes: The fast StochRSI(14) reached its maximum reading of 100.00, while the Williams %R printed at -0.50, both entering historical overbought territory. This suggests that following the vertical surge, short-term profit-taking may prompt technical consolidation back toward moving average support above $4,342.
4. Summary
The capture of Mokha port and the restriction of transit through Bab el-Mandeb subject global energy flows to dual maritime chokeholds. This supply-side disruption supports elevated energy benchmark prices and sustains persistent global inflation pressures, reinforcing the rationale for central banks to maintain restrictive monetary policy.
Nevertheless, on the short-term technical timeframe, gold staged a decisive V-shaped rebound from the $4,300.77 trough, establishing support above the $4,328 moving average band. Attention now turns to whether prices can digest extreme StochRSI overbought readings through high-level consolidation. Holding above the $4,323–$4,328 moving average zone would favor extended corrective gains, whereas renewed macro headwinds could trigger another retest of the critical $4,300 handle.