

1. Saudi Energy Infrastructure Hit and Halted for Weeks Ahead of FOMC Decision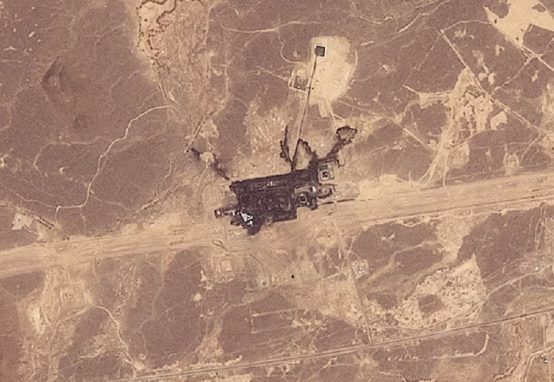
On Tuesday, Yemen's Houthi movement launched missile and drone attacks targeting the Khamis Mushait Air Base in southern Saudi Arabia. This follows earlier strikes that forced Saudi Arabia's East-West pipeline facility offline. Fresh assessments indicate that the primary pipeline will remain largely non-operational for 3 to 5 weeks.
Concurrently, commercial cargo transits through the Strait of Hormuz dropped to fewer than 10 vessels per day over the weekend, reigniting fears over supply bottlenecks and headline inflation. In response, Brent crude rose $1.37 (+1.3%) to trade at $107.05 per barrel.
Global market attention is centered on Thursday's upcoming Federal Reserve monetary policy decision. Beyond the rate hike itself, Chair Kevin Warsh's forward-looking guidance—specifically whether the central bank embarks on a meeting-by-meeting tightening cycle or adopts a more measured path—will serve as the primary market driver.
2. 30-Minute Chart: Intraday Rebound Encounters Resistance Around $4,300 MA Cluster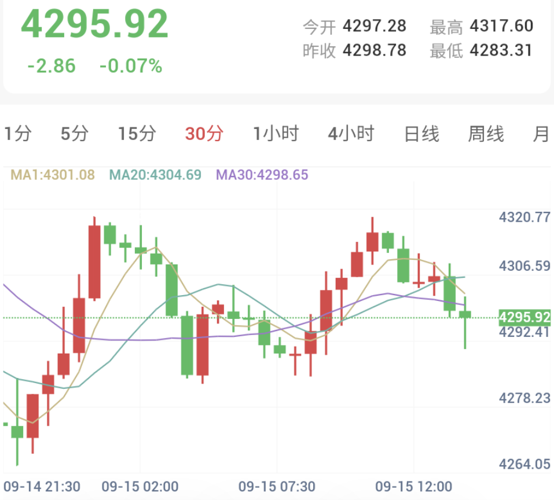
As of 13:41, spot gold traded at $4,295.92/oz, down 0.07% ($2.86 intraday), consolidating closely around the $4,300 psychological level.
Gold opened at $4,298.78 before testing an intraday trough of $4,283.31 during early morning trade. A modest counter-rally produced consecutive bullish candles to reach a session peak of $4,317.60. However, upside momentum weakened at those levels, prompting a stepped pullback below $4,300.
From a moving average perspective, three key MA lines have compressed into a tight, horizontal consolidation band between $4,298 and $4,304. Price action is currently hugging the lower bound of this cluster, indicating overhead selling pressure and defensive posturing ahead of the Fed rate announcement.
3. 30-Minute Technical Indicators Tilt Bearish as Sensitive Oscillators Reach Oversold Levels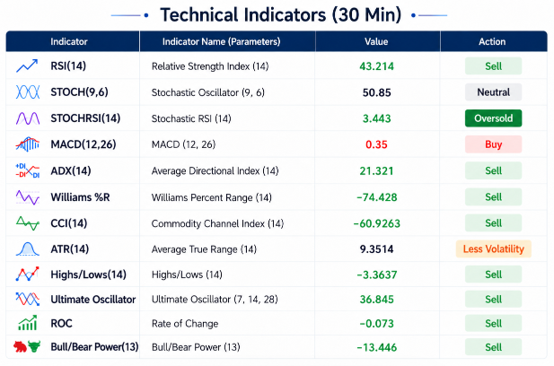
On the 30-minute technical timeframe, following the retreat from session highs, technical summaries reflect a bearish bias (1 buy, 1 neutral, 8 sell signals). While sellers retain the upper hand short-term, momentum indicators signal limited downside room:
Oscillators remain subdued: The Relative Strength Index (RSI 14) stands at 43.21 in bearish territory below the 50 median; the Commodity Channel Index (CCI 14) reads -60.92, retaining a sell bias; and Williams %R prints -74.42, hovering in oversold-leaning territory.
Trend indicators show divergence: The Average Directional Index (ADX 14) at 21.32 confirms the pullback is corrective rather than an aggressive unilateral breakdown. Meanwhile, the MACD (12,26) remains in positive territory at 0.35, suggesting the morning support base has not completely deteriorated.
Short-term oscillators flash oversold warnings: The Fast Stochastic RSI (StochRSI 14) registered an extreme low of 3.44, deep within the oversold threshold. This technical signal indicates selling pressure has been heavily absorbed, pointing to potential mean reversion toward the $4,300 moving average band.
4. Energy Supply Disruptions Support Fed Hawkish Stance
Damage to Saudi infrastructure alongside depressed maritime flows through Hormuz poses tangible supply challenges to global energy markets. Persistent strength in oil prices reinforces underlying inflation stickiness, providing macro backing for the Fed to deliver an interest rate increase and maintain hawkish forward guidance. Prior to the official announcement, choppy trading around the $4,300 level is expected to persist.
Saudi Pipeline Shut for 3–5 Weeks: Gold Fluctuates Around $4,300 Ahead of FOMC Decision
Published: 2026-09-15 13:55:48