

I. News Events
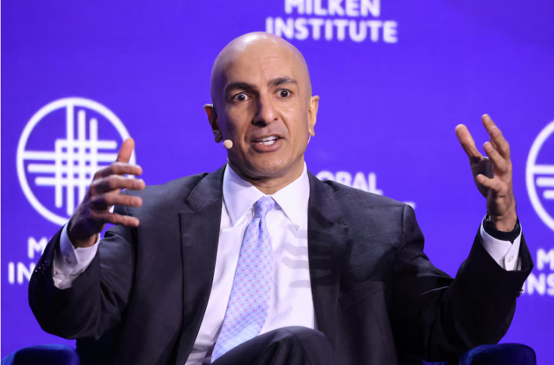
Core Inflation Persists as Fed Policymakers Reaffirm Tightening Stance
Minneapolis Federal Reserve President Neel Kashkari explicitly noted in an interview that broad-based inflation pressures across the US economy remain excessive. Beyond the surge in primary energy costs triggered by the Middle East conflict, sticky price gains in core sectors such as services continue to pose severe challenges. Kashkari supported the recent policy rate increase to 3.75%–4.00% and highlighted that an overwhelming majority of policymakers anticipate additional rate hikes before year-end.
Middle East Turmoil Fuels Energy Costs While Resilient Economy Backs Tightening
The expanding conflict across the Middle East—marked by strikes on tankers navigating the Strait of Hormuz and the disruption of critical pipelines—has driven international energy benchmarks substantially higher. While noting the Fed cannot directly govern supply-side energy costs, Kashkari stressed that robust domestic economic growth and strong productivity give the central bank the necessary leeway and tools to rein in aggregate inflation toward its 2% objective.
II. 30-Minute Chart Technical Analysis
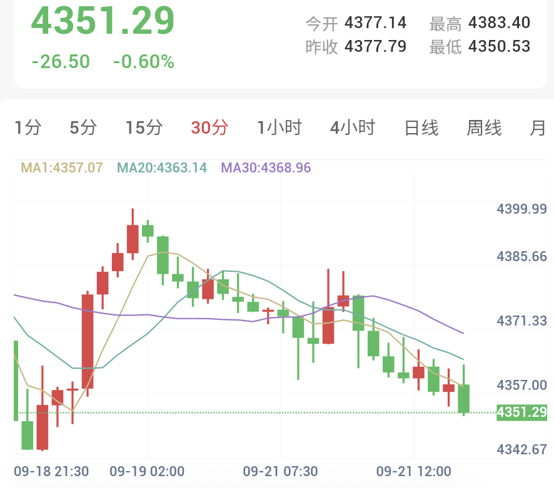
As of 13:48 Beijing time, spot gold traded at $4,351.29/oz, down $26.50 or 0.60% intraday.
From a moving average perspective, bullion displays a pronounced bearish configuration. The MA1 ($4,357.07), MA20 ($4,363.14), and MA30 ($4,368.96) have formed a bearish downward-diverging structure. Following a decisive breakdown below the $4,360 support level, price momentum accelerated lower, keeping gold pinned beneath all key moving average bands, which now exert heavy overhead resistance.
III. 30-Minute Technical Indicators
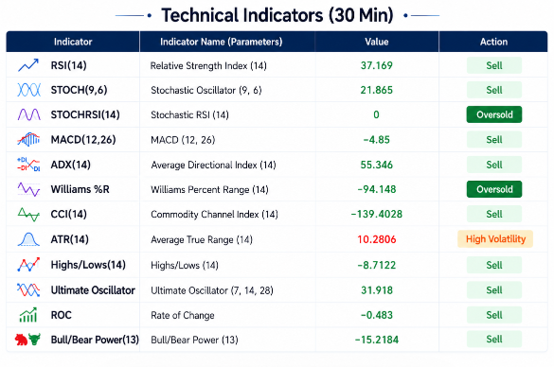
On the 30-minute timeframe, the technical dashboard prints an aggregate 'Strong Sell' rating (0 Bullish, 0 Neutral, 9 Bearish). Bearish momentum retains absolute control, though several sensitive oscillators are flashing extreme oversold readings:
Core Relative Oscillators:
Relative Strength Index RSI(14): 37.17, holding in bearish territory;
Stochastic Oscillator STOCH(9,6): 21.87, signalling sell pressure;
Commodity Channel Index CCI(14): -139.40, remaining under firm bearish control.
Trend Momentum Gauges:
Medium-Term Momentum MACD(12,26): -4.85, tracking below the zero line with active sell signals;
Average Directional Index ADX(14): 55.35, registering an extraordinarily high reading that confirms powerful downward trend strength;
Rate of Change ROC: -0.483, issuing a sell indication;
Bull/Bear Power(13): -15.21, reflecting overwhelming bearish dominance.
Sensitive Oversold Indicators:
Stochastic RSI StochRSI(14): 0.00, bottoming out at absolute oversold extremes;
Williams %R: -94.15, deeply submerged in extreme oversold territory;
Average True Range ATR(14): 10.28, denoting high intraday volatility.
IV. Summary
Expanding Middle East hostilities and compromised shipping chokepoints → Bottlenecks in primary energy supplies → Surging energy inputs elevate cross-sector costs → Core services inflation stickiness intensifies → Fed strengthens hawkish policy and rate hike expectations → Macro interest rates remain elevated → Opportunity costs of non-yielding bullion rise → Gold prices remain under severe downward pressure.
Synthesizing the 30-minute K-line and technical dashboard, bullion has retreated to test the $4,351 zone following breaks beneath key moving averages, with the elevated ADX of 55 underscoring consistent unilateral selling velocity. Nonetheless, the StochRSI dropping to 0 and Williams %R at extreme lows signal strong technical requirements for an oversold corrective pause.
Downside support primarily spans the $4,340–$4,350 psychological threshold, where a confirmed breakdown would unlock further declines. Overhead, initial corrective resistance aligns near the MA1 at $4,357, with secondary resistance at the MA20 near $4,363. Until macro tightening expectations see a structural reversal, any technical oversold bounce will likely meet relentless overhead moving average resistance.