

I. Lower Energy Prices Prompt Dip-Buying as Spot Gold Recovers Above $4,360 in Asia
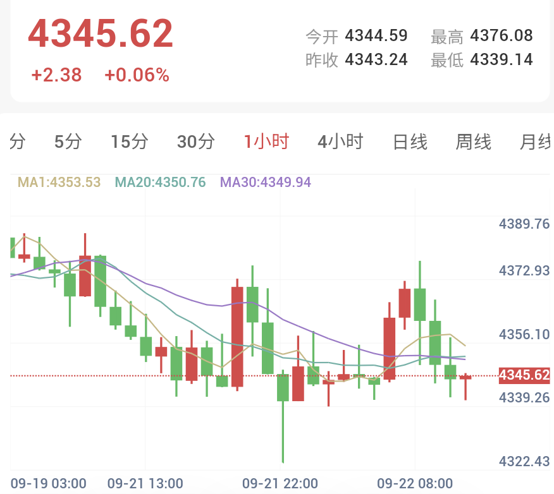
On September 21, spot gold retreated lower, dropping below support at $4,335 to probe an intraday trough near $4,322 before settling down 0.78% at $4,343.70 per ounce; gold futures similarly settled down nearly 0.9%. Entering the Asian trading session on September 22, softer energy benchmark prices tempered marginal inflation concerns, supporting a modest rebound in spot gold that touched an intraday peak of $4,376.08 before consolidating near $4,345.
II. Hawkish Fedspeak Boosts Dollar and Sustains Pressure on Bullion
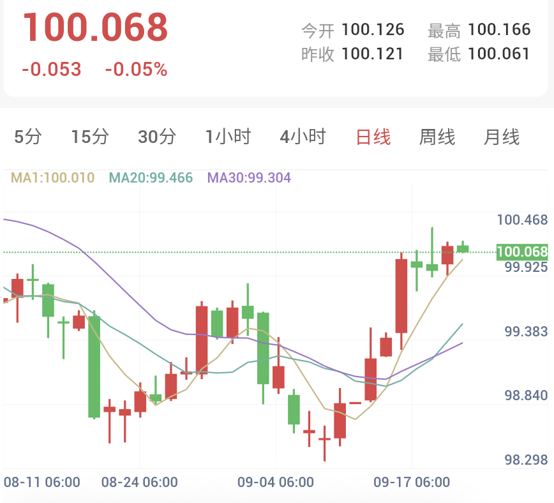
The US Dollar Index gained 0.2% on September 21, building on its post-FOMC weekly rally of over 1% to touch fresh two-month highs. CME FedWatch data indicates market-implied odds of a December rate hike stand at 88%, while expectations for at least a 25 bps rate hike at the October gathering have climbed to roughly 55%. Jim Wyckoff, senior market analyst at Kitco Metals, noted that expectations for extended monetary tightening continue to impose direct headwinds on precious metals.
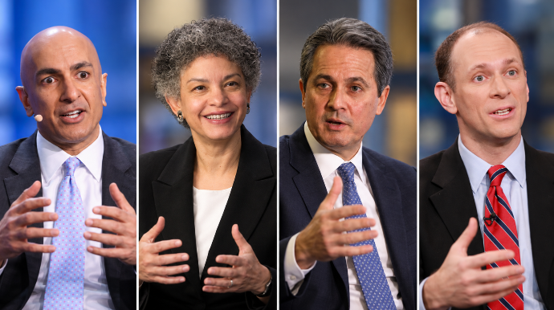
Chicago Fed President Austan Goolsbee observed that US inflation drivers extend beyond the tariff and energy shocks of the past 18 months, noting that expanding demand is actively lifting price levels. He highlighted that rising AI-related capital expenditures and persistent services inflation demonstrate broad-based pressures, suggesting the Fed may need to accelerate its tightening pace and adopt more front-loaded measures. Concurrently, St. Louis Fed President Alberto Musalem noted that energy volatility creates ripple effects across other categories while aggregate demand remains robust, arguing policymakers must consider proactive measures to curb price pressures.
III. Benchmark Energy Contracts Slump as Geopolitical Risks Intersect with Diplomatic Expectations
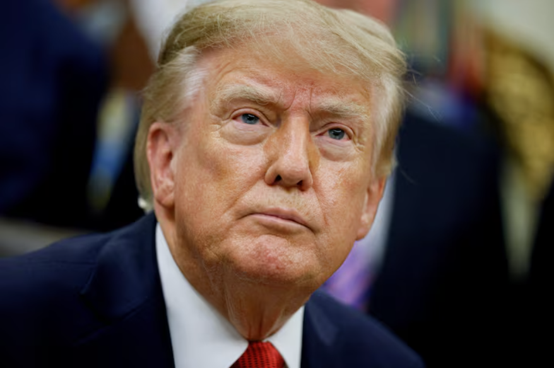
European benchmark crude contracts fell to a 12-day low on September 21 to close at $100.34 per barrel, with North American benchmark contracts logging single-day declines exceeding 4%. On the geopolitical front, market attention focused on diplomatic avenues surrounding the UN General Assembly, where Donald Trump indicated willingness to engage with Iranian President Pezeshkian, and Iranian envoys transmitted specific terms for resuming talks to mediating channels. Elsewhere in the Middle East, Yemeni Houthi forces broadened operations along the Red Sea coast, launching strikes against sensitive targets near Riyadh and Aramco installations, following a late-stage cancellation of planned US airstrikes. Saudi Arabia concurrently expanded energy throughput via the Strait of Hormuz to offset logistics bottlenecks across alternate pipelines.
IV. Treasury Yield Curve Flattens Further as Analysts Anticipate Intermediate Digestion
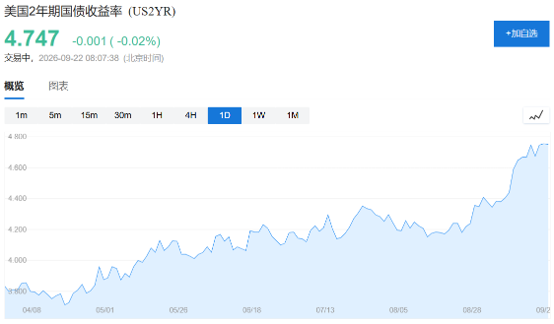
US fixed-income metrics show the 2-year Treasury yield hovered near multi-year highs, maintaining a noticeable flattening trajectory along the 2-year/10-year yield curve. While the 10-year yield edged lower alongside declining energy inputs, it remained historically firm, with the 10-year TIPS breakeven inflation rate anchoring near 2.3%. The US core PCE price index rose 3.7% year-over-year in July, reflecting persistent underlying momentum. Analysts at TD Securities noted that downside risks for precious metals appear contained in the near term, citing modest CTA selling activity and noting that price dips are increasingly viewed by long-term allocators as constructive accumulation zones. With spot gold down roughly 17% from its late-February peak, markets remain focused on digesting hawkish Fed rhetoric while tracking energy market swings and geopolitical headlines.