

I. News Events
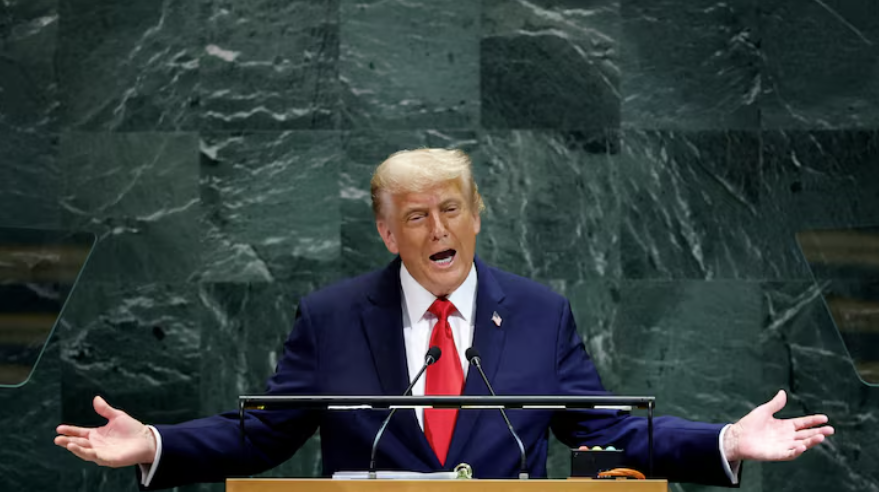
US President Scheduled for Extensive Bilateral Meetings During UNGA
Reuters reported on September 22, 2026, that US President Donald Trump will address the UN General Assembly and hold bilateral or small-group sessions with at least 11 leaders spanning four continents. Key agenda items include the Iranian standoff, the four-and-a-half-year Ukraine conflict, and Gulf regional security. The United States also plans to finalize an agreement with Denmark and Greenland to expand its military footprint while curbing strategic competitors' access. A Reuters/Ipsos poll showed Trump's approval rating at 32%, with domestic living costs and conflict management drawing widespread public scrutiny.
Hostilities in Yemen Center Around Strategic Kahboub Mountains and Red Sea Access
Yemeni Houthi forces launched operations aimed at capturing strategic heights in the Kahboub mountainous sector across Taiz and Lahij provinces, seeking to sever connectivity between Red Sea coastal corridors and areas controlled by Saudi-backed forces. The New York Times reported that Trump halted a planned US military airstrike at the final moment; this account has not been independently verified by Reuters. US Central Command referred inquiries to the White House, which did not immediately issue a statement.
II. 30-Minute Chart Technical Analysis
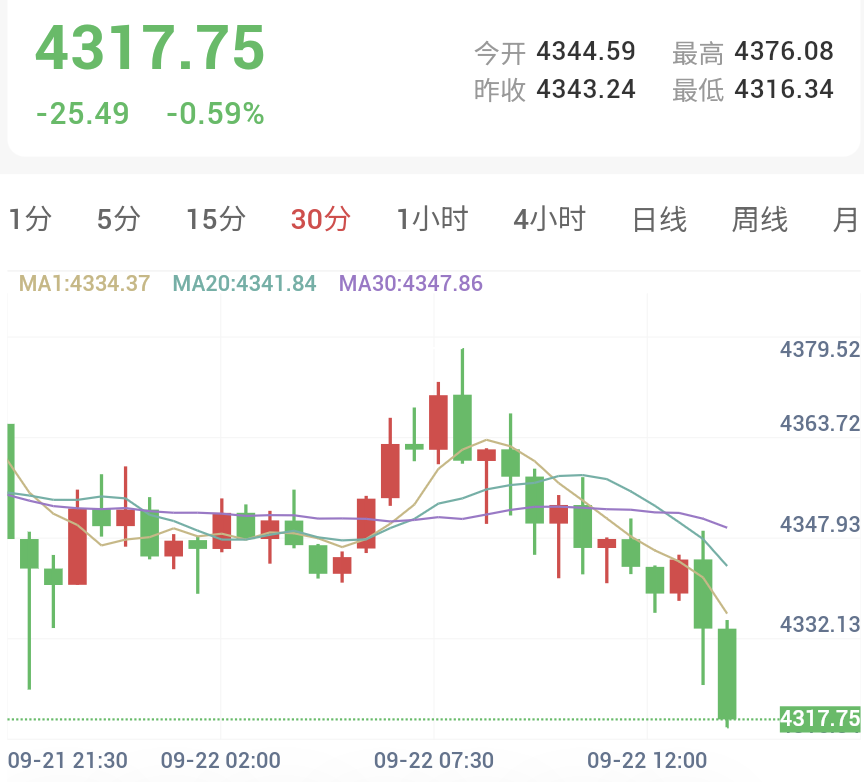
As of 13:38 Beijing time on September 22, 2026, spot gold traded at $4,317.75/oz, down $25.49 or 0.59% intraday, against an opening print of $4,344.59, a session high of $4,376.08, an intraday low of $4,316.34, and a previous close at $4,343.24. The latest 30-minute candle probed $4,316.34, tracking substantially beneath the MA1 ($4,334.37), MA20 ($4,341.84), and MA30 ($4,347.86).
With MA1 trading beneath MA20 and MA20 below MA30, the moving average framework exhibits a short-cycle bearish alignment, underscoring sequential downward shifts across real-time prices, short-term averages, and intermediate trendlines. Initial support lies at $4,316, below which the $4,300 psychological milestone serves as the secondary checkpoint. Overhead, initial resistance aligns near $4,334, with the primary corrective resistance band located between $4,342 and $4,348; the daily open at $4,344.59 rests squarely within this zone, followed by broader resistance at the daily high of $4,376.08. Only a decisive recapture of key moving averages would materially alleviate short-term downside pressure.
III. 30-Minute Technical Indicators
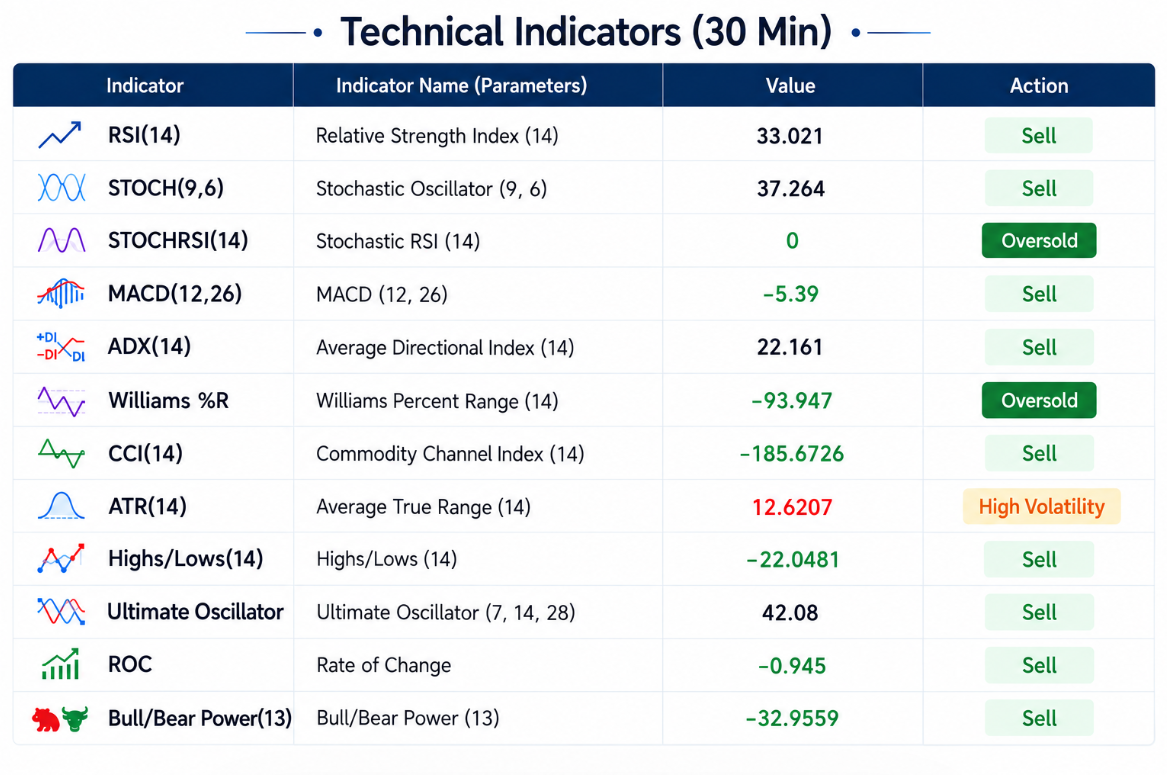
As of 13:38 on September 22, 2026, the aggregate technical rating registers as 'Strong Sell' (0 Buy, 0 Neutral, 9 Sell signals). Two Oversold readings and one High Volatility tag function as environmental condition alerts and are excluded from directional totals.
Core Relative Oscillators:
Relative Strength Index RSI(14): 33.021, Sell, indicating prevailing bearish momentum in weak territory;
Stochastic Oscillator STOCH(9,6): 37.264, Sell, maintaining a weak profile with subdued recovery momentum;
Commodity Channel Index CCI(14): -185.6726, Sell, significantly below normal bounds, confirming downward strength while highlighting deep short-term oversold conditions;
Ultimate Oscillator: 42.08, Sell, reflecting insufficient multi-timeframe buying power.
Trend Momentum Indicators:
MACD(12,26): -5.39, Sell, persistent negative values confirming ongoing downward momentum;
Average Directional Index ADX(14): 22.161, Sell, showing moderate trend strength rather than extreme exhaustion;
Rate of Change ROC: -0.945, Sell, negative velocity confirming downward momentum;
Highs/Lows(14): -22.0481, Sell, structural high-low metrics tilting bearish;
Bull/Bear Power(13): -32.9559, Sell, sellers holding decisive command.
Sensitive Oversold Indicators:
Stochastic RSI StochRSI(14): 0.00, Oversold, touching absolute lower extremes, favoring corrective pauses;
Williams %R: -93.947, Oversold, submerged in deep oversold territory, elevating the risk of chasing fresh shorts;
Average True Range ATR(14): 12.6207, High Volatility, elevated price dispersion implying support and resistance may be tested rapidly.
IV. Conclusion
Regional escalation and maritime bottlenecks → Supply constraints across primary energy and shipping corridors → Sustained elevated input costs → Sticky consumer-level inflation → Reinforced global tightening expectations and climbing Treasury yields → Increased opportunity cost of holding non-yielding gold → Sustained downward pressure on bullion. This macro sequence aligns with the 30-minute structural breakdown, bearish moving average alignment, and nine unanimous sell signals, forming the core framework behind the descent toward $4,316.
Nevertheless, a StochRSI of 0, Williams %R at -93.947, and CCI at -185.6726 present a short-term divergence between trend momentum and extreme oversold readings. This divergence accommodates technical relief bounces or short-covering consolidations rather than a trend reversal. An ADX of 22.161 reflects an established but non-extreme trend, while elevated ATR indicates key price zones could face immediate testing.
If the $4,316 to $4,300 region holds, conditions favor a technical bounce targeting $4,334 initially, followed by the $4,342–$4,348 barrier. Failure to reclaim $4,348 keeps the 30-minute structure firmly bearish, whereas a breach beneath $4,316 exposes $4,300 as the decisive downside pivot. Ongoing market bias must strictly follow confirmed price action around these primary structural levels.