

I. News Events: Softer Dollar and Treasury Yields Support Gold Rebound
According to a Reuters report on October 21, the US dollar remained under pressure after touching a three-week low in the preceding session, as declining Treasury yields and easing crude oil prices eroded the greenback's yield advantage.
Concurrently, overnight gains on Wall Street alongside advances across Japanese and South Korean equities on Wednesday dampened safe-haven demand for the dollar.
Carol Kong, an economist and currency strategist at the Commonwealth Bank of Australia, pointed out that earnings from mega-cap tech corporations influence the dollar through equity sentiment and economic growth expectations.
She noted that as Middle East conflicts eventually conclude and energy prices normalize, safe-haven bids for the dollar will recede; however, overseas capital inflows into US assets over the coming months could provide moderate structural support for the greenback.
Two primary transmission channels for gold have consequently clarified: a weaker dollar reduces purchase costs for non-dollar buyers, while retreating Treasury yields lower the opportunity cost of holding non-yielding bullion.
Upcoming attention centers on whether yield declines can persist, and whether upcoming tech earnings or regional geopolitical shocks reignite dollar safe-haven flows.
II. 30-Minute Chart: Low-Level Bounce Probes Session Highs, Moving Average Band Turns to Support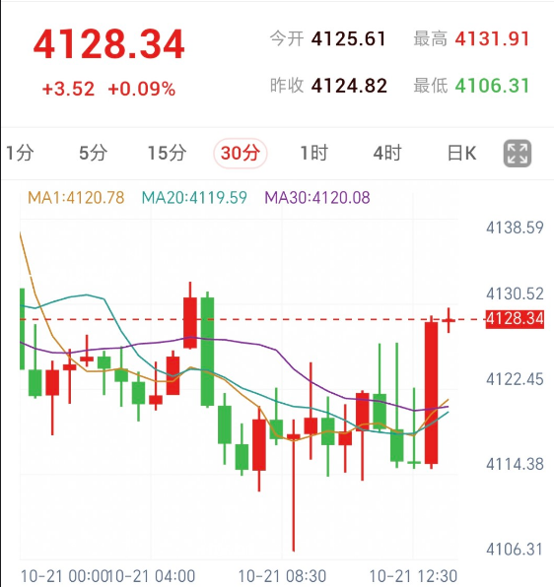
London gold traded at $4,128.34 per ounce, up $3.52 or 0.09% intraday.
The session opened at $4,125.61 against a prior close of $4,124.82, logging an intraday high of $4,131.91 and an intraday low of $4,106.31.
The 30-minute timeframe initially printed an extended lower shadow down to $4,106.31, followed by candle bodies consolidating between $4,114.38 and $4,122.45.
A subsequent impulsive bullish candle propelled prices from near $4,114.38 back toward $4,128, where candle bodies have since narrowed into high-level consolidation beneath session peaks.
Current quotes stand above MA1 ($4,120.78), MA20 ($4,119.59), and MA30 ($4,120.08), with all three averages converging between $4,119.59 and $4,120.78 to establish a dynamic zone for short-term directional bias.
Sustaining footing above this cluster preserves the recovery structure; a breakdown back below the band would weaken near-term strength.
Overhead, initial focus rests on $4,131.91; a confirmed 30-minute close above this intraday high would strengthen upside continuation prospects.
III. 30-Minute Technical Indicators: Momentum Tilts Constructive While Trend Strength Remains Low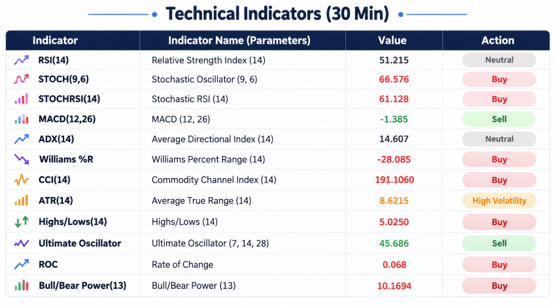
As of 12:48 on October 21, the 30-minute technical indicators print as follows:
RSI(14) stands at 51.215, holding within the 30–70 middle band just above 50, rated Neutral by the platform.
STOCH(9,6) registers 66.576 within the 20–80 band, classified as Buy.
STOCHRSI(14) prints 61.128 within the 20–80 band, classified as Buy.
MACD(12,26) stands at -1.385 below the zero line, classified as Sell.
ADX(14) registers 14.607, below the standard trend-strength threshold of 20, rated Neutral.
Williams %R prints -28.085 within the -80 to -20 range, classified as Buy.
CCI(14) prints 191.1060, well above +100 in positive territory, classified as Buy.
ATR(14) records 8.6215, categorized by the platform as high volatility.
Highs/Lows(14) reads 5.0250 in positive territory, classified as Buy.
Ultimate Oscillator registers 45.686, residing below the 50 midpoint, classified as Sell.
Rate of Change (ROC) prints 0.068 in positive territory, classified as Buy.
Bull/Bear Power(13) registers 10.1694 in positive territory, classified as Buy.
This setup reflects warmer short-term momentum coupled with weak trend conviction: stochastic indicators, ROC, and bull/bear power favor a continuation, while MACD remains sub-zero and the Ultimate Oscillator lingers below 50.
With ADX under 20, whether the bounce can achieve consecutive stable closes warrants close scrutiny; elevated CCI readings alongside high volatility ratings mean follow-through and retracement depth near $4,131.91 remain pivotal near-term benchmarks.
IV. Summary and Market Outlook
The pullback across the dollar and Treasury yields has provided a constructive external setting for gold, lifting prices back above all three 30-minute moving averages.
Holding above $4,119.59–$4,120.78 alongside a breakout above $4,131.91 would support further rebound extension; conversely, slipping back beneath the moving average cluster would reintroduce consolidation pressure.
This article is provided for market information reference only and does not constitute investment advice. Precious metals trading involves risk of principal loss.
(Compiled and Edited by Lucky Gold Global Limited)
US Dollar Pressured as Gold Rebounds to Near Intraday Highs
Published: 2026-10-21 14:06:47