

I. Gold Trades at $4,019.09, Pinned Beneath 1-Hour Moving Averages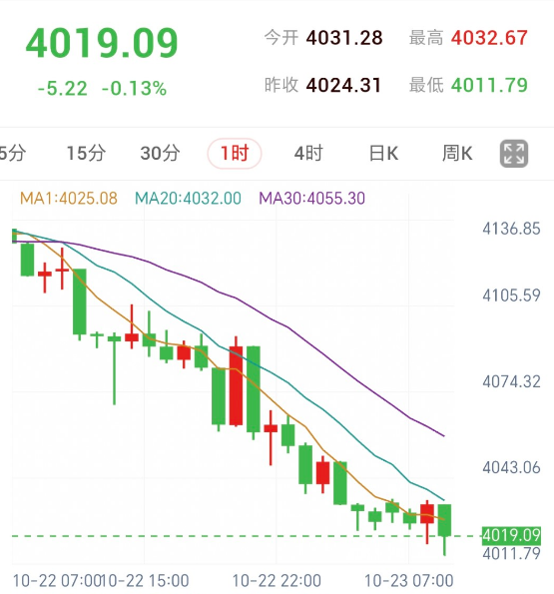
near 30.82)
On October 23, London gold traded at $4,019.09 per ounce, down $5.22 or 0.13% from the previous close.
The session opened at $4,031.28, recording an intraday high of $4,032.67 against a trough of $4,011.79, following yesterday's close at $4,024.31.
Overnight energy surges alongside steep declines in US equities kept gold pinned within a soft consolidation pattern, turning investor attention toward next week's Federal Reserve meeting and forthcoming inflation gauges.
On the 1-hour timeframe, MA1 stands at $4,025.08, MA20 at $4,032.00, and MA30 at $4,055.30, with price action hovering below all three downward-sloping averages.
RSI(14) prints at 30.82, closely probing the 30 oversold benchmark and reflecting weak near-term momentum.
Chart dynamics center first on whether the intraday floor near $4,011.79 holds; on a rebound, the moving average band between $4,025.08 and $4,032.00 represents the primary test of recovery strength, with the session peak of $4,032.67 situated nearby.
Reclaiming this moving average cluster remains the primary technical prerequisite for stabilizing price action.
II. Houthis Target Saudi Infrastructure, Benchmark Energy Jumps 4.0%
According to a Reuters report on October 22, fresh Houthi strikes targeting Saudi Arabian assets reignited fears over prospective Middle East energy transit disruptions.
European benchmark energy surged 4.0% to settle at $113.17 per barrel, brushing five-month highs; US benchmark futures climbed 2.4% to finish at $99.47 per barrel.
As fuel benchmarks push higher, supply-driven inflation risks are re-emerging as a dominant theme weighing on precious metals.
David Meger, Director of Metals Trading at High Ridge Futures, told Reuters that surging overnight energy costs have amplified market anxieties regarding persistent inflation and further Federal Reserve tightening.
With both CPI and PPI prints exceeding forecasts last week, markets are heavily discounting extended policy restriction, while prospective supply chain threats add heightened uncertainty ahead of the central bank gathering.
III. AI Capex Anxieties Resurface, Tech-Heavy Nasdaq Plunges 2.60%
Wall Street technology shares faced widespread liquidation overnight.
Reuters reported that Meta's corporate disclosures revived investor skepticism surrounding the monetization timeline of colossal artificial intelligence capital expenditures, with shares falling sharply amid scrutiny over non-voting share issuance plans.
Concurrently, Tesla dropped 3.1% after trimming capital expenditure forecasts, and the Philadelphia Semiconductor Index sank 6.7%, cementing technology equities as the epicentre of cross-asset de-risking.
The Nasdaq Composite tumbled 2.60% to register its steepest single-session drop since early June, while the S&P 500 retreated in tandem.
Intensified equity volatility unfolding concurrently with regional geopolitical friction channeled substantial defensive capital into sovereign bonds.
IV. US Treasuries Draw Safe-Haven Inflows, 10-Year Yield Falls 19.3 Basis Points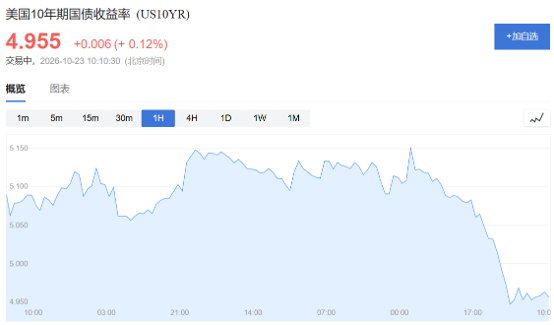
Defensive inflows triggered sharp rallies in Treasury paper, sending the benchmark 10-year yield down 19.3 basis points to 4.953% in its largest single-day decline since March 2023.
Reuters noted that the equity rout enhanced the relative safe-haven appeal of US government debt, driving a stark divergence between tech stocks and the bond complex.
However, bullion failed to capitalize on tumbling yields, declining in tandem with bond rates.
Escalating energy inflation bets and liquidity adjustments following equity liquidations actively countered potential rate tailwinds for gold.
Precious metals markets continue to digest the macro drag of sticky inflation and high policy rates, leaving traders monitoring subsequent yield stabilization.
V. FOMC Decision and US Core PCE Inflation Take Center Stage
The Federal Reserve convenes its scheduled monetary policy meeting on October 27–28.
Reuters reporting indicates that markets anticipate the policy rate will remain unchanged at 3.75%–4.00%, though the CME FedWatch tool shows traders pricing a 78% probability of a rate hike in December.
Against sticky price data and elevated energy volatility, official assessments of underlying disinflation and forward policy cues will guide market sentiment.
Following the FOMC decision, the October 29 release of the US Personal Consumption Expenditures (PCE) price index represents the next major macro catalyst.
A resilient inflation print would solidify expectations for prolonged monetary restriction, whereas decelerating figures would prompt traders to scale back December tightening wagers.
Gold's near-term trajectory remains fundamentally tied to Middle East energy security, Federal Reserve forward guidance, and the upcoming PCE print.
(Compiled and Edited by Lucky Gold Global Limited)
Houthi Strikes Stoke Energy Supply Fears as Gold Retreats to Near $4,019
Published: 2026-10-23 10:23:55