

I. News Events: AI Capex Concerns Spark Tech Selloff as 10-Year Yield Tumbles 19 Basis Points
On October 23, London gold traded at $4,019.50 per ounce, down $4.81 or 0.12% from the previous close.
Global risk appetite cooled noticeably as capital rotated into US Treasuries, the Japanese yen, and the Swiss franc, keeping bullion's low-level bounce constrained beneath key moving averages.
According to a Reuters report on Friday, mounting anxieties over the massive financing requirements of the artificial intelligence sector weighed on technology equities, sending the Nasdaq down over 2% overnight with Asian bourses remaining under pressure.
Meta's colossal AI capital expenditure projections and proposed issuance of non-voting shares sparked widespread investor apprehension regarding cash burn and equity dilution.
The equity liquidation channeled capital into safe-haven government debt, driving the 10-year Treasury yield down approximately 19 basis points overnight.
Concurrently, traders pared bets on further monetary tightening by the Federal Reserve, concerned that decelerating data center investments could dampen broader US economic expansion.
While tumbling bond yields reduce the opportunity cost of holding non-yielding gold, the durability of any recovery hinges on whether bullion can attract persistent safe-haven bids.
Reuters' Morning Bid highlighted that a slowdown in AI infrastructure spending could sap US economic growth momentum, while elevated crude prices from ongoing Middle East friction sustain underlying inflation pressures that complicate the Fed's policy path.
Caught between growth headwinds and inflation constraints, market focus centers on October flash PMIs across Europe, the UK, and the US, alongside subsequent reactions across energy, sovereign yields, and precious metals.
II. 30-Minute Chart: Low-Level Rebound Probes MA30 Resistance in Corrective Phase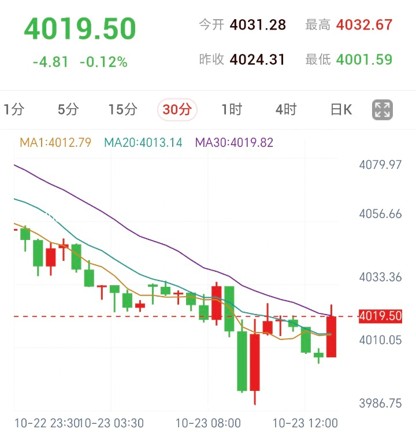
On the 30-minute timeframe, gold initially drifted lower before printing an elongated bearish candle; after probing intraday lows, price rebounded swiftly, consolidated in a tight band, and launched another corrective upward push.
The MA30 continues to slope downward, with the current bounce directly probing this overhead barrier.
Key moving average parameters read as follows:
MA1: $4,012.79
MA20: $4,013.14
MA30: $4,019.82
Current quotes stand above MA1 and MA20 while hovering marginally beneath MA30, confirming that price action is undergoing a technical recovery phase following the preceding drop.
With the two shorter-term averages clustered tightly together, they provide a dynamic support band on pullbacks; overhead, whether price can hold above MA30 serves as the primary gauge of recovery strength.
III. 30-Minute Technical Indicators: Composite Sell Rating with Overbought Oscillators and Firm Trend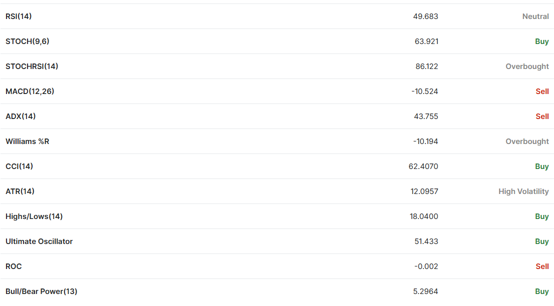
The 30-minute technical summary reflects a composite 'Sell' rating, with individual indicators recording as follows:
RSI(14) registers 49.683, positioned near the 50 neutral midpoint within the 30–70 range.
STOCH(9,6) prints at 63.921 within the 20–80 band, classified as Buy.
STOCHRSI(14) stands at 86.122, above 80 in overbought territory.
MACD(12,26) prints -10.524 below the zero line, classified as Sell.
ADX(14) registers 43.755, well above the 25 benchmark, reflecting elevated underlying trend strength.
Williams %R reads -10.194, situated within the -20 to 0 overbought zone.
CCI(14) stands at 62.4070 within the -100 to 100 neutral zone, classified as Buy.
ATR(14) records 12.0957, categorized by the platform as high volatility.
Highs/Lows(14) registers 18.0400 in positive territory, classified as Buy.
Ultimate Oscillator prints 51.433, hovering just above the 50 balance line.
Rate of Change (ROC) registers -0.002, marginally below zero, classified as Sell.
Bull/Bear Power(13) prints 5.2964 in positive territory, classified as Buy.
The technical landscape displays a coexistence of near-term mean-reversion and a broader bearish trend: while oscillators and strength indicators lean positive, MACD and ROC remain sub-zero, maintaining the platform's composite Sell rating.
With both STOCHRSI and Williams %R in overbought bands and ATR signaling high volatility, corrective bounces may face choppy whipsaws; stabilizing above overhead moving averages remains the critical technical requirement.
IV. Summary and Market Outlook
Declining Treasury yields have temporarily relieved holding cost pressures on gold, yet elevated oil prices preserve structural inflation hurdles.
Going forward, close attention should be paid to post-PMI shifts in Treasury yields and bullion safe-haven flows.
Technically, if a 30-minute candle closes above MA30 at $4,019.82 and holds above the MA1/MA20 band ($4,012.79–$4,013.14) on subsequent retests, rebound continuation conditions will improve.
Conversely, slipping back beneath the $4,012.79–$4,013.14 moving average cluster will weaken the recovery structure, tipping the market back into a soft consolidation bias.
Precious metals trading involves risk of principal loss.
(Compiled and Edited by Lucky Gold Global Limited)
Tech Stock Selloff Bolsters US Treasuries as Gold Rebound Faces Resistance
Published: 2026-10-23 14:02:46