

I. News Events: Trump Comments on Middle East Conflict and Energy as Election Anxieties Mount
On October 27, US President Donald Trump campaigned in Mississippi on October 26 for Republican Senator Cindy Hyde-Smith.
Citing what he described as a robust economic backdrop, Trump projected Republican victories in the upcoming races and reiterated that energy commodity prices would soon decline precipitously.
While acknowledging that the conflict involving Iran has inflated energy costs, Trump maintained that hostilities would conclude swiftly.
Reuters reported, however, that Republican strategists note voter discontent regarding tariffs and war-driven inflation is tightening race margins across several traditional Republican stronghold states.
Several non-partisan political analysts now view Senator Hyde-Smith's reelection bid as contested.
The November 3 midterm elections will determine all 435 seats in the US House of Representatives and 35 seats in the Senate, with congressional majorities deciding the viability of Trump's forward legislative agenda.
For bullion, upcoming attention centers on whether lower energy prices and regional conflict de-escalation materialize.
A de-escalation in Middle East geopolitical risks would likely diminish gold's safe-haven premium; conversely, sustained energy costs fueling persistent inflation and higher interest rate expectations would maintain carrying cost pressures on precious metals.
II. 30-Minute Chart: Dense Moving Average Cluster Caps Price Action in Weak Consolidation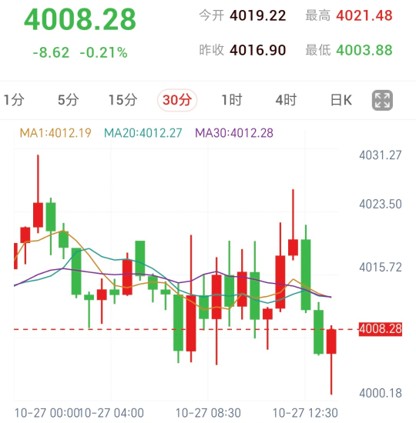
London gold traded at $4,008.28 per ounce, down $8.62 or 0.21% from the prior close, remaining pinned beneath the 30-minute moving average band clustered near $4,012.
As the US midterm elections enter their final week, crude dynamics, inflation expectations, and Middle East developments remain the dominant macro drivers.
Despite sporadic low-level bounces, price action remains capped beneath short-term averages:
MA1 stands at $4,012.19
MA20 stands at $4,012.27
MA30 stands at $4,012.28
With all three moving averages converged tightly within the $4,012.19–$4,012.28 zone, any rebound faces immediate overhead resistance across this dynamic band.
Momentum indicators show RSI(14) at 46.31 below the 50 neutral midpoint, reflecting subdued momentum.
A 30-minute candle close reclaiming this moving average cluster followed by support confirmation on a pullback would strengthen near-term recovery prospects; failing to do so leaves the soft consolidation bias intact.
III. 30-Minute Technical Indicators: Composite Strong Sell Rating with Deep Oversold Readings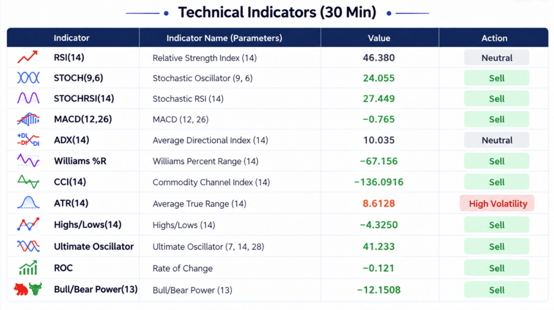
As of the 13:44 update on October 27, 30-minute metrics display a composite rating of 'Strong Sell,' with technical indicators and moving averages both rated 'Strong Sell.' Tracked metrics print as follows:
RSI(14) registers 46.380 within the 30–70 neutral band, lingering below 50.
STOCH(9,6) prints at 24.055 in the lower end of the 20–80 range, indicating a Sell.
STOCHRSI(14) stands at 27.449, indicating a Sell.
MACD(12,26) registers -0.765 below the zero line, indicating a Sell.
ADX(14) prints 10.035, well below 20, reflecting low directional trend strength.
Williams %R reads -67.156, indicating a Sell.
CCI(14) stands at -136.0916, dropping below -100 into oversold territory.
ATR(14) prints 8.6128, categorized by the platform as reflecting high volatility.
Highs/Lows(14) reads -4.3250 in negative territory, indicating a Sell.
Ultimate Oscillator registers 41.233, below the 50 midpoint with soft momentum.
Rate of Change (ROC) prints -0.121 in negative territory, indicating a Sell.
Bull/Bear Power(13) registers -12.1508 in negative territory, indicating a Sell.
Negative momentum readings align closely with price action pinned beneath moving averages, leaving sell signals dominant.
However, an ADX below 20 suggests that while direction is weak, trend conviction remains modest; deeply oversold CCI readings warn of intermittent low-level bounces, and high ATR volatility ratings highlight potential for intraday whipsaws.
IV. Summary and Market Outlook
Whether energy benchmarks normalize and geopolitical conflict subsides will dictate the balance between inflation pressures and safe-haven demand for gold.
Technically, bullion remains soft in the near term, with chart recovery contingent upon reclaiming the dynamic moving average band near $4,012.
Sustained suppression beneath these averages will prolong low-level oscillations; only a verified breakout and successful retest above the cluster will invalidate the current bearish bias.
Precious metals trading involves significant volatility and the risk of principal loss.
(Compiled and Edited by Lucky Gold Global Limited)
Trump Discusses Economy and Middle East Outlook as Gold Remains Capped Beneath Moving Averages
Published: 2026-10-27 14:09:00