

I. Fundamental Analysis
The Federal Reserve officially hiked rates by 25 bps, but the dot plot delivered the true market shock:
At 02:00 Beijing time, the Federal Reserve raised the target range for the federal funds rate from 3.50%–3.75% to 3.75%–4.00% in a unanimous 12-0 vote. Since this 25 bps rate hike had already been heavily discounted by the market, the move itself was not the primary driver behind bullion's steep drop.
The substantive shock originated from the updated dot plot: among 18 officials, only 2 projected no further action this year, 12 projected another 25 bps hike before year-end, and 4 penciled in a cumulative 50 bps in additional hikes—meaning 16 officials view the tightening campaign as unfinished. Gold consequently reversed sharply from roughly $4,365 ahead of the decision, shedding approximately $125 in short order to briefly touch lows near $4,240.
Warsh affirms inflation remains too high as markets price 'the next rate hike':
In the press conference, Fed Chair Kevin Warsh emphasized that inflation has remained 'too high for too long' and that data since the summer has not evidenced sufficient underlying improvement. Simultaneously, the Fed raised economic growth and inflation projections while lowering the unemployment rate outlook, underscoring its belief that the broader economy remains resilient enough to absorb further tightening.
Post-meeting market pricing indicates the implied probability of at least one more rate hike before year-end stands near 87%, though opinions remain divided on whether action will occur in October. The market narrative has formally transitioned from 'will they hike in September' to 'how many more hikes will occur this year.'
Energy supply strains ease temporarily:
Another notable overnight development stemmed from Saudi Arabia, which initiated ship-to-ship transfers to increase crude flows toward Asian refineries. This temporarily assuaged market fears over prolonged export shut-ins, prompting noticeable pullbacks across Brent and WTI crude benchmarks.
Nevertheless, broader conflict and maritime security issues remain unresolved, with the East-West Pipeline and Red Sea shipping facing ongoing constraints. Bullion's primary restraint remains the post-FOMC tightening in broader financial conditions: the US 2-year Treasury yield rose to 4.725%, the 10-year hovered near 5%, and the US Dollar Index broke back above 100.
Consequently, while gold mounted a swift rebound from around 4257 to reclaim the 4300 handle this morning, current price action remains a relief correction following the hawkish policy shock.
II. Multi-Timeframe Technical Analysis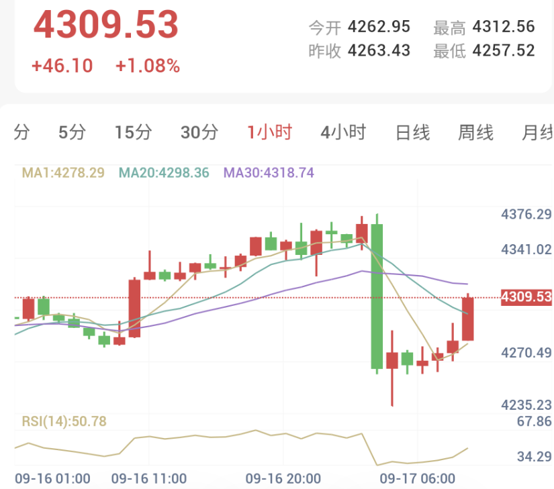
1-Hour Timeframe (Intraday Short-Term: Rapid Rebound)
Trend Assessment: The 1-hour chart currently trades near 4309.53, with an intraday high of 4312.56 and a low of 4257.52.
Following the overnight decision, price printed a prominent, elongated bearish candle before finding dip-buying support in the 4250–4270 zone and initiating a swift rebound.
The 1-hour structure has moved from an acutely depressed state into technical repair, but the 4318–4320 area marks the first critical moving average resistance. Only a sustained recovery above this threshold would confirm that the overnight breakdown is beginning to see durable structural repair.
Indicator Monitoring: RSI(14) rebounded to 50.78, returning from oversold extremes to neutral territory and signaling substantial easing of selling pressure, though a definitive bullish trend structure has yet to form.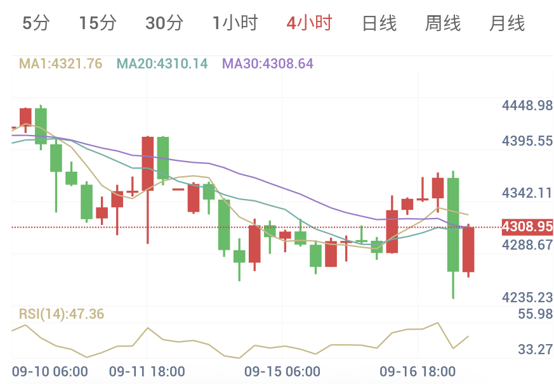
4-Hour Timeframe (Medium-Term Trend: Weak Consolidation)
Trend Assessment: Price on the 4-hour timeframe currently oscillates near the MA20 and MA30, but remains below MA1.
The overnight long-bodied bearish candle impaired the preceding rebound structure near 4340–4360; however, price recovered rapidly from the 4235–4250 base, indicating the market is seeking intermediate equilibrium near 4300 rather than extending a sustained unilateral plunge.
Indicator Monitoring: RSI(14) reads 47.36, remaining below the 50 median line. The 4-hour posture remains subdued; given that price is situated within the dense cluster of MA20 and MA30, direct short chasing near 4300 carries limited structural advantage.
III. Trading Execution Framework
In summary, while the broader policy backdrop is decidedly hawkish, both the 1-hour and 4-hour timeframes are engaged in post-decision corrective rebounds. Today's execution therefore adopts a conditional plan to short on stalled rebounds rather than pursuing shorts directly near 4300.
Strategic Bias: Short on Rebound
Trading Signal: Sell (Condition-Triggered)
Confidence Score: 70 / 100
Entry Monitoring Zone: 4318.00 - 4325.00
Median Entry Level: 4321.50
Reference Stop-Loss: 4347.00
Target Take-Profit: 4270.00
Risk-to-Reward Ratio: Approx. 1 : 2.0
【Execution Notes】
With price having rebounded swiftly from around 4257 to 4309, immediate selling at current levels is not advised. A superior setup involves waiting for price to extend toward the 4318–4325 resistance zone.
This area coincides with the 1-hour MA30 and 4-hour MA1, forming a well-defined technical moving average ceiling.
If price enters this zone and exhibits long upper shadows on the 1-hour chart, bearish engulfing formations, fails to sustain a break above 4325, or drops back beneath 4315, such signals will serve as confirmation of upward exhaustion to deploy short positions.
Risk Disclaimer
Financial markets carry inherent risks, including the potential loss of principal. This analysis is provided for informational purposes only and does not constitute direct investment advice. Investors must make independent evaluations and make decisions aligned with their personal risk tolerance.
16 Fed Officials Back Further Hikes; Gold Rebounds Following Sharp Selloff (2026/09/17)
Published: 2026-09-17 09:53:25