

Market Fundamental Analysis
At its September policy meeting, the Federal Reserve announced a 25 basis point rate increase, raising the target range for the federal funds rate to 3.75%-4.00%. This marks the first rate hike in over three years since July 2023, as well as the first under Chair Kevin Warsh's tenure. The concurrently published quarterly dot plot showed that most policymakers project another rate increase before the end of the year, with the median 2026 rate projection revised up by 30 basis points from June—delivering an overall hawkish stance that exceeded market expectations. Driven by this guidance, the US Dollar Index surged above the 100 benchmark to record its largest single-day gain in over two months. With US Treasury yields hovering at elevated levels and the opportunity cost of non-yielding bullion rising sharply, spot gold dropped over 1.3% overnight while spot silver shed more than 2%, both registering multi-week lows.
Meanwhile, concerns surrounding Middle East energy supplies eased. Saudi Arabia's damaged East-West Pipeline is slated to restore approximately half of its transport capacity within days and achieve full operational recovery within six weeks. Simultaneously, maritime transit volumes through the Strait of Hormuz saw a modest uptick, with commercial tankers traversing normally each day, contributing to an intraday pullback of over 2% in international crude prices.
Persistent net inflows into gold ETFs, institutional dip-buying, and the structural pillar of global central bank gold accumulation provided a sturdy buffer against deeper bullion declines. Data indicates domestic gold ETFs logged continuous net inflows across 9 consecutive trading sessions, absorbing 1.903 billion yuan, with cumulative net inflows surpassing 14.3 billion yuan since July. Globally, central bank bullion purchases remain firm amid ongoing official foreign reserve diversification, building a durable medium-to-long term floor for precious metals as dip buyers surfaced near key technical support.
Following the absorption of the hawkish FOMC outcome and short-covering triggered by technical oversold conditions, gold and silver staged a powerful recovery from session lows through Asian and European trading hours, lifting spot gold back above $4,330/oz. Markets have begun pricing potential tightening into October, with forthcoming inflation and employment prints serving as critical determinants for the forward policy path. Technically, after fully digesting the decision's headwinds, precious metals are displaying a classic 'sell-the-rumor, buy-the-fact' relief rebound while remaining structurally confined within a broader corrective consolidation.
Gold Technical Analysis
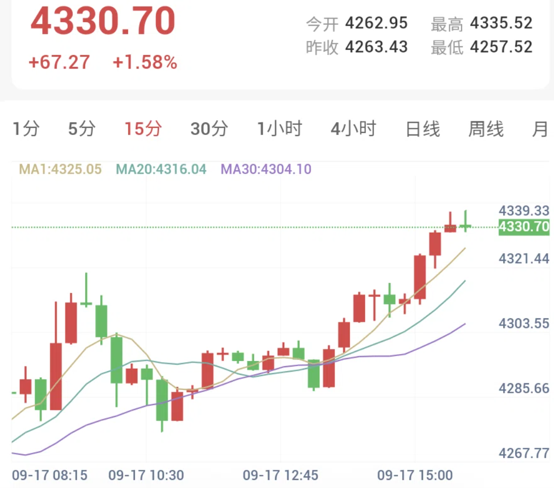
Daily Framework: Opening at $4,262.95/oz during today's Asian session, price bottomed at an intraday low of $4,257.52 before rebounding forcefully, touching an intraday peak of $4,335.52 and currently trading near $4,330.70/oz (+1.58%). The daily moving average system retains a golden cross with the broader bias pointing upward; price trades between the 20-period and 80-period moving averages, warranting patience for a sustained breakout above the 20-MA before initiating trend-following long positions.
Intraday Short-Term (15-Minute): Moving averages have pivoted into a bullish alignment, with price establishing firm ground above both the 20-MA ($4,316.04) and 30-MA ($4,304.10). Should price retest the $4,310.00–$4,315.00 zone and stabilize, light long entries can be considered, with stop-loss anchored at the daily low of $4,257.52 and targets set between $4,345.00 and $4,355.00; a breakdown below $4,300.00 calls for an immediate exit.
Silver Technical Analysis
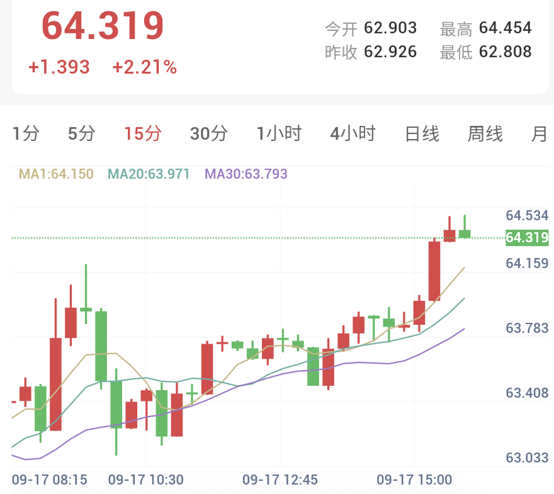
Daily Framework: Spot silver opened at $62.903/oz today, touched a session low of $62.808, and rebounded sharply to reach a high of $64.454, currently trading near $64.319/oz (+2.21%). Daily moving averages maintain a golden cross with an upward tilt; price action fluctuates between short- and long-term moving averages, and medium-term long opportunities should await a confirmed break back above the 20-MA.
Intraday Short-Term (15-Minute): Moving averages have shifted into a bullish alignment, with price consolidating above the 20-MA ($63.971) and 30-MA ($63.793). If price pulls back toward the $64.000–$64.100 zone and stabilizes, light long positions can be evaluated, with stop-loss anchored at the daily low of $62.808 and targets looking toward $64.800–$65.000; a breakdown beneath $63.80 warrants stepping aside.
Risk Warning
Trading markets involve unpredictable risks, including but not limited to the loss of principal. This analysis is for reference only and does not constitute direct investment advice. Investors must make independent judgments and decisions based on their own risk tolerance.