

I. Fundamental Analysis
Hawkish data fails to cap gold as retreating Treasury yields and energy prices dominate
Overnight, gold demonstrated clear resilience against bearish developments. US initial jobless claims fell to 196,000, while the Philadelphia Fed manufacturing index and its price components remained robust; market expectations for ongoing Fed policy tightening showed little sign of cooling. Nonetheless, bullion rallied sharply from near $4,310 to touch an intraday peak of $4,381.60.
The substantive catalyst driving the rebound was the synchronized pullback in US Treasury yields and energy costs. Yields on 2-year, 10-year, and 30-year US Treasuries fell by roughly 7 bps, 7 bps, and 6 bps respectively, significantly reducing the opportunity cost of holding non-yielding gold. Concurrently, Saudi Arabia expanded energy supplies via alternative routes, prompting Brent and WTI crude to extend their pullbacks and softening energy-driven inflation fears.
However, upward headwinds have not dissipated entirely. Market pricing continues to imply roughly a 50% probability of a follow-up 25 bps rate hike in October. Furthermore, vessel throughput across the Strait of Hormuz remains unusually depressed amid persistent clashes between Saudi Arabia and Houthi forces, leaving energy and geopolitical risks subject to recurrent flare-ups.
Focus today remains on whether Treasury yields, the US dollar, and crude prices can maintain their downward trajectory, which will dictate the durability of this gold rebound.
II. Multi-Timeframe Technical Analysis
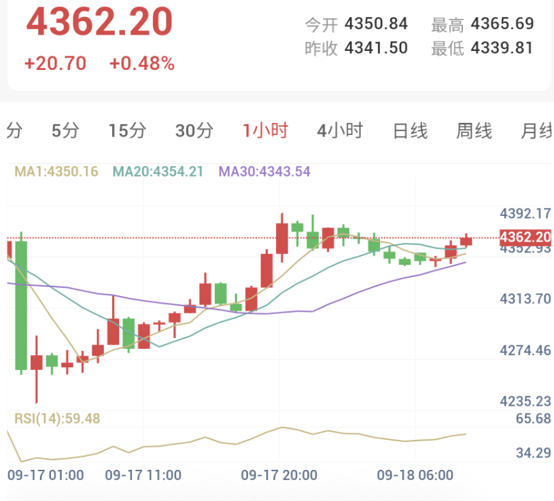
1-Hour Timeframe (Intraday Short-Term: Strong Technical Recovery)
Gold currently trades near 4362.20, with a daily high of 4365.69 and a low of 4339.81.
Price has reclaimed the MA1 (4350.16), MA20 (4354.21), and MA30 (4343.54). Following the overnight surge, price consolidated around 4350 before advancing again, keeping the short-term recovery structure intact.
However, moving averages have yet to form a clear bullish divergence, making this move more appropriately categorized as a firm technical repair rather than confirmed unilateral upward trend expansion.
RSI(14) registers at 59.48, holding in neutral-to-bullish territory.
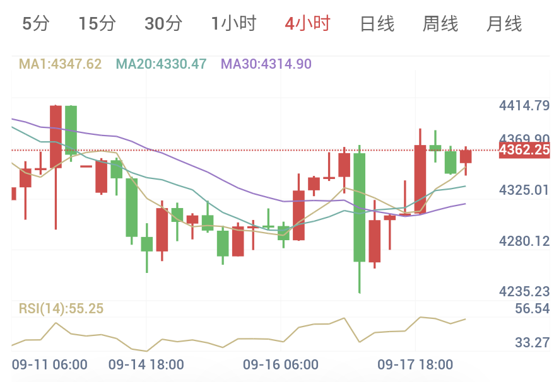
4-Hour Timeframe (Medium-Term Structure: Corrective Rebound)
On the 4-hour timeframe, price hovers around 4362.25, standing above the MA1, MA20, and MA30 with moving averages aligned upward across short-to-medium horizons, indicating that the rebound initiated near 4280 remains underway.
RSI(14) prints at 55.25 as bullish momentum recovers; however, notable overhead resistance looms between 4370–4382 and near 4400, cautioning against prematurely declaring a new unilateral bull leg.
III. Trading Execution Framework
With 1-hour and 4-hour structures exhibiting noticeable improvement, immediate short chasing at current levels is not advised. Today's execution focuses on a conditional short strategy once the rebound confronts technical resistance.
Strategic Bias: Sell on Stalled Rebound
Trading Signal: Sell (Condition-Triggered)
Confidence Score: 65 / 100
Key Entry Reference: Near 4375
Reference Stop-Loss: 4390
Target Take-Profit: 4340
Risk-to-Reward Ratio: Approx. 1 : 2.33
【Execution Notes】
Wait for price to advance into the 4370–4382 resistance zone. Should price print long upper shadows, bearish engulfing patterns, fail to post higher highs, or briefly breach 4380 before dropping back rapidly, conditional short setups can be engaged.
A sustained close above 4390 invalidates this tactical short plan; a decisive breakout through 4400 would necessitate reassessing whether gold is transitioning from a corrective rebound into an aggressive bullish structure.
Risk Disclaimer
Financial markets involve unpredictable risks, including but not limited to the loss of principal. This analysis is for reference only and does not constitute direct investment advice. Investors must make independent judgments and decisions based on their own risk tolerance.