

Market Fundamental Analysis
International energy prices retreated for a third consecutive trading session, as Saudi Arabia's damaged East-West Pipeline is slated to restore approximately half of its capacity within days. With supply outage concerns cooling, receding inflation expectations have become the primary driver behind this precious metals rebound. Benchmark crude dropped into the $102.4–$103.8/barrel range, declining roughly 1%–2.3% intraday. Over the prior week, pipeline attacks and disrupted shipping in the Red Sea and Strait of Hormuz drove energy benchmarks to six-week highs, reinforcing the Federal Reserve's tightening narrative. As alternative logistics and repair expectations gathered traction, inflation premiums drained from sovereign bond markets, pulling the 10-year US Treasury yield off its highs. The resulting decrease in the opportunity cost of non-yielding bullion served as the direct catalyst for gold's back-to-back rallies across September 17 and 18.
On September 18, the Bank of Japan lifted its policy rate by 25 basis points to 1.25%—marking its highest borrowing cost since 1995—while compressing its hiking cadence from once every six months to roughly every three months, further escalating funding costs for the world's premier funding currency. Although USD/JPY rose modestly to hover near 156.25 in a measured initial reaction, the yen's status as a global carry trade funding currency implies that ongoing BOJ normalization will steadily raise financing burdens on yen-funded commodity and US dollar asset longs. Over the medium-to-long term, this dynamic strengthens the appeal of gold, which operates independently of interest rate differentials.
The World Gold Council's August report indicated that US dollar-denominated London gold surged 13% during the month, while RMB-denominated Shanghai gold gained 8.4%. The rally was predominantly driven by sizable increases in speculative long positioning, continuous net inflows into global gold ETFs, improving derivatives market breadth, and synchronized greenback weakness. Notably, gold ETFs in the Chinese market added roughly 11 metric tons in August alone. While gold's upward momentum saw moderate turbulence in early September due to pre-FOMC jitters, price action has stabilized as the rate hike materialized. Among major investment banks, Goldman Sachs reiterated its year-end 2026 price target of $4,900/oz, while JPMorgan trimmed its year-end projection to $4,500/oz. Structural central bank accumulation and institutional ETF demand continue to anchor the long-term price floor.
Gold Technical Analysis
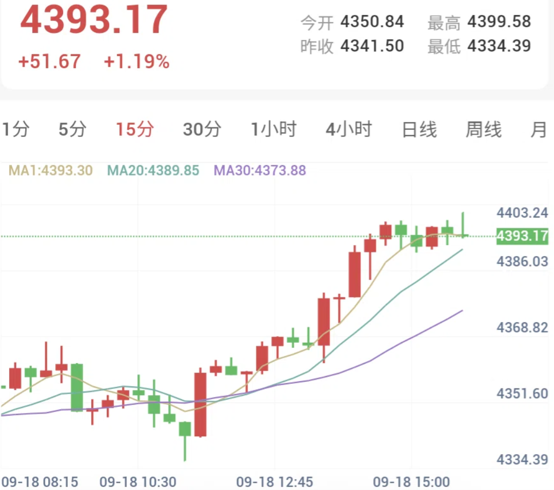
Daily Framework: Opening at $4,350.84/oz during today's Asian session, spot gold probed an intraday low of $4,334.39 before trending higher, reaching a peak of $4,399.58 and currently trading near $4,393.17/oz (+1.19%). Daily moving averages maintain a golden cross configuration with the broader trajectory favoring bulls; price trades between the 20-day and 80-day moving averages, warranting patience for a sustained breakout above the 20-MA before adding trend-following long exposure.
Intraday Short-Term (15-Minute): Moving averages display a classic bullish alignment, with price consolidating securely above the 20-MA ($4,389.85) and 30-MA ($4,373.88). The morning breakout through the 20-MA near $4,389.85 offered an advantageous entry reference, with risk controlled against the session low at $4,334.00. Targeting a 2:1 risk-reward objective or employing a trailing 20-MA exit are sound tactical approaches while securing open gains. As price approaches the major $4,400.00 psychological threshold, positions can be held on a confirmed breakout, while signs of exhaustion call for immediate profit preservation.
Silver Technical Analysis
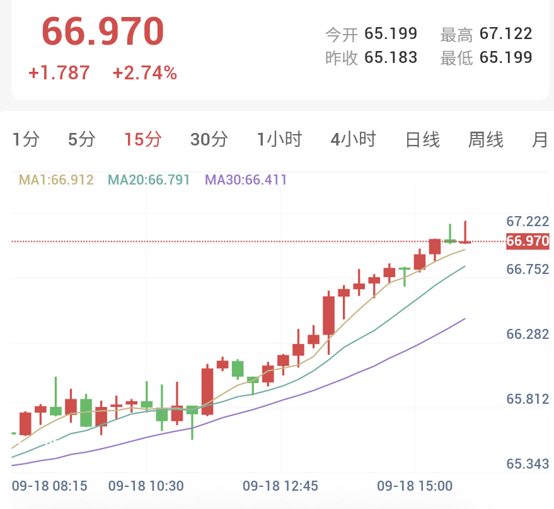
Daily Framework: Spot silver opened at $65.199/oz today, displaying strong buyer momentum to print a high of $67.122, currently trading near $66.970/oz (+2.74%). The daily moving average system retains a golden cross with a bullish tilt. Price action has breached above the daily 20-MA; traders should monitor whether daily closes confirm this level to evaluate medium-term continuation entries.
Intraday Short-Term (15-Minute): Moving averages are aligned bullishly, with silver trading above the 15-minute 20-MA ($66.791) and 30-MA ($66.411). The early morning push above $66.791 provided a constructive long entry level, with stop-loss anchored beneath the intraday low of $65.199. Trailing the 20-MA remains viable, exiting upon an hourly breakdown below this moving average to lock in accumulated profits.
Risk Warning
Trading markets involve unpredictable risks, including but not limited to the loss of principal. This analysis is for reference only and does not constitute direct investment advice. Investors must make independent judgments and decisions based on their own risk tolerance.