

I. Fundamental Analysis
Middle East Escalation and Sharp Decline in Hormuz Transit
Geopolitical tensions in the Middle East escalated noticeably over the weekend. Houthi forces claimed strikes against the Saudi capital Riyadh and Yanbu energy facilities along the Red Sea coast. While Saudi authorities confirmed intercepting a missile directed toward Riyadh, substantive damage to energy infrastructure remains unverified.
Maritime conditions in the Strait of Hormuz warrant acute observation. Kpler tracking data revealed that merely 5 commercial cargo vessels transited on Saturday, with zero registered passages on Sunday—a severe contraction compared to 31 passages logged over the previous weekend.
Brent and WTI crude rose roughly 0.8% this morning, reinforcing energy inflation anxieties. Simultaneously, the US 10-year Treasury yield climbed back above 5% on Friday, continuing to cap gold's upward expansion. Bullion briefly surged to $4,400.60 on Friday, closing the week up approximately 1% and snapping a three-week losing run. The near-term crux rests on whether $4,400 can be decisively cleared and whether advancing crude prices trigger renewed upward momentum in sovereign bond yields.
Additionally, the United States, Denmark, and Greenland announced a security arrangement expanding the US military presence in Greenland; however, Danish and Greenlandic officials underscored that sovereignty remains unchanged, with formal agreements awaiting execution.
II. Multi-Timeframe Technical Analysis
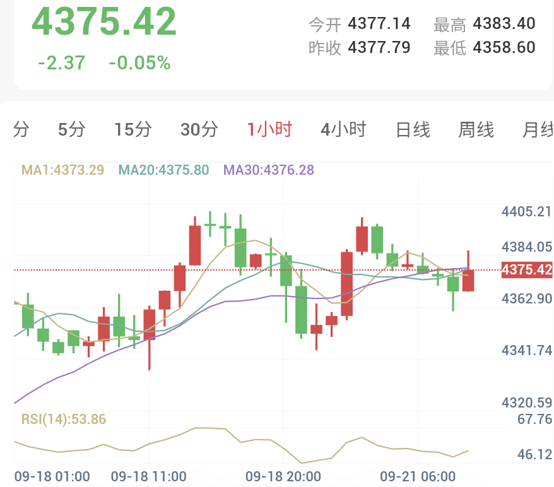
1-Hour Timeframe (Intraday Short-Term: Sideways Consolidation)
Spot gold currently trades near $4,375.42, within an intraday range spanning a high of $4,383.40 and a low of $4,358.60. Price hovers above the MA1 while resting slightly beneath the MA20 and MA30; the three moving averages are tightly clustered, indicating that the market has entered horizontal consolidation following Friday's recovery without establishing a unilateral directional breakout. The 14-period RSI prints at 53.86 in neutral territory. Near-term overhead resistance sits at $4,383, with structural resistance anchored at $4,400–$4,405; immediate underlying support rests at $4,358 and near $4,340.
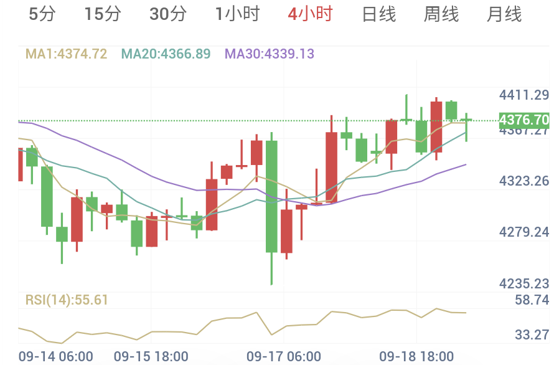
4-Hour Timeframe (Medium-Term Structure: Firm Corrective Rebound)
On the 4-hour chart, gold holds securely above the MA1, MA20, and MA30, reflecting a notably improved moving average configuration across short-to-medium horizons. The RSI(14) registers at 55.61, occupying neutral-to-bullish territory. While the medium-term rebound structure remains intact, persistent selling pressure near $4,400 mandates treating price action as a technical repair until a confirmed breakout materializes.
III. Trading Execution Framework
With the 4-hour technical bias pointing upward and weekend geopolitical friction providing structural safe-haven backing, today's tactical posture favors buying on pullbacks rather than chasing rallies beneath major overhead resistance at $4,400.
Strategic Bias: Buy on Pullbacks
Trading Signal: Buy (Condition-Triggered)
Confidence Score: 65 / 100
Observation Range: 4350 - 4445
Reference Midpoint: 4397.50
Reference Stop-Loss: 4290
Target Take-Profit: 4612.50
Risk-to-Reward Ratio: Approx. 1 : 2.00
【Execution Notes】
Favorable risk-reward entries emerge upon observing bullish reversal signals within the $4,358–$4,370 support pocket. In the event of an immediate upward impulse, entries should await a confirmed breakout above $4,400–$4,405 followed by a successful retest, avoiding direct chases into psychological resistance.
A decisive break beneath $4,338–$4,343 would markedly diminish rebound momentum; a violation of $4,290 invalidates this tactical swing long framework.
Risk Disclaimer
Trading markets involve unpredictable risks, including but not limited to the loss of principal. This analysis is for reference only and does not constitute direct investment advice. Investors must conduct independent evaluations and make decisions aligned with their personal risk tolerance.