

I. Fundamental Analysis
Hawkish Rate Expectations Outweigh Lower Energy Costs as Rebound Stalls
The primary divergence dominating gold overnight was the disconnect between falling energy prices and receding Treasury yields—which would typically support bullion—against gold's brief slide toward $4,322. The market was predominantly driven by intensifying expectations for continued Federal Reserve rate hikes and a firm US dollar.
Neel Kashkari noted that US inflation remains broadly too high; Austan Goolsbee observed that 'there is no labor market problem, but there is an inflation problem' and indicated rates must move further if price stickiness persists; Alberto Musalem argued that additional hikes are better executed sooner rather than later; and Susan Collins projected that a second rate hike before year-end may well be required. This synchronized hawkish chorus lifted market pricing for an additional 25 bps rate hike in October to roughly 55%, generating substantial headwinds for gold.
On the diplomatic front, former President Trump expressed willingness to meet Iranian President Pezeshkian on the sidelines of the UN General Assembly, spurring diplomatic de-escalation trades that triggered a 4.5% plunge in energy prices. However, no formal meeting has been confirmed and no new ceasefire agreement exists. Concurrently, the IRGC warned that any escalation could alter their operational tactics, weaponry, and target selections, ensuring geopolitical risk premiums have not fully dissipated.
The prevailing macro narrative balances Fed tightening expectations and a strong dollar capping upside against lower energy costs and softer bond yields anchoring the downside, leaving gold in a choppy consolidation range rather than a defined directional trend.
II. Multi-Timeframe Technical Analysis
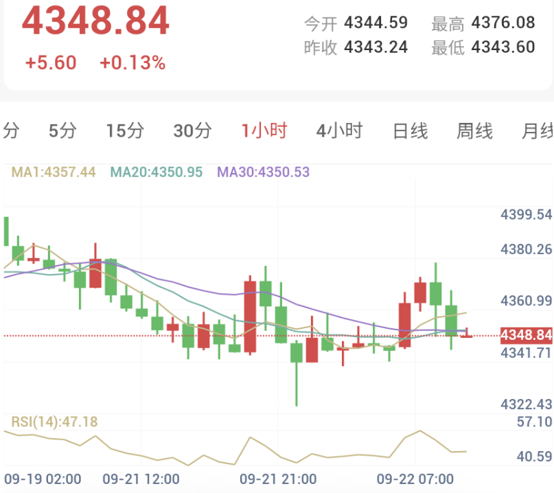
1-Hour Timeframe (Intraday Short-Term: Neutral-to-Bearish)
Spot gold currently trades near $4,348.84, bounded within a daily range between a high of $4,376.08 and a low of $4,343.60. Price has slipped beneath the MA1, MA20, and MA30 after an overnight recovery above $4,370 met renewed selling, highlighting limited short-term buying persistence. The RSI(14) prints at 47.18 in neutral-to-soft territory. Initial overhead resistance spans $4,351–$4,357, followed by secondary resistance at $4,370–$4,376; key support rests at $4,342 and overnight lows near $4,322.
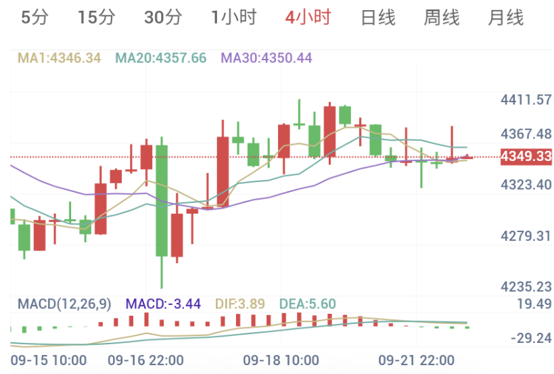
4-Hour Timeframe (Medium-Term Structure: Consolidating with a Bearish Tilt)
On the 4-hour timeframe, gold hovers slightly above the MA1 but remains suppressed beneath the MA20 and MA30. Simultaneously, MACD reads -3.44 as short-term momentum turns softer, signaling that the rebound launched from $4,322 has not yet developed into a sustained upward trend. Current price action is best characterized as a mild bearish consolidation awaiting directional confirmation.
III. Trading Execution Framework
With the 1-hour structure soft and the 4-hour chart lacking a distinct directional breakout—coupled with conflicting fundamental forces between hawkish rate hikes and declining energy inputs—a sideline observational stance remains warranted today.
Strategic Bias: Continued Observation
Trading Signal: Observe
Confidence Score: 40 / 100
Observation Range: 4330 - 4376
Core Resistance: 4370 - 4376
Core Support: 4340 - 4322
【Execution Notes】
Should gold establish firm stability above $4,376, traders can evaluate potential recovery attempts back toward $4,400. Conversely, a breakdown beneath $4,340 and a failure to hold $4,322 would threaten renewed downside acceleration. Until the current trading boundary experiences a valid breakout, deploying directional exposure remains premature.
Risk Disclaimer
Trading markets involve unpredictable risks, including but not limited to the loss of principal. This analysis is for reference only and does not constitute direct investment advice. Investors must conduct independent evaluations and make decisions aligned with their personal risk tolerance.