

I. Fundamental Analysis
Last Friday, the US September non-farm payrolls added only 29k, well below the expected 90k; the unemployment rate ticked up from 4.1% to 4.2%, annualized average hourly earnings slowed to 3.0%, and July/August employment data were cumulatively revised down by 60k. Following this clear cooling in employment, market pricing for a Fed October rate hike dropped to roughly 20%, driving gold up over 1% intraday. However, the rebound failed to hold into the close, with spot gold ultimately retreating toward $4,140 and dropping about 3.4% for the week.
Geopolitical risks heated up again over the weekend. The Houthis claimed missile and drone attacks on Saudi Aramco facilities in Riyadh and Khurais, pushing energy prices up toward $103.06 per barrel in early Asian trade Monday.
Cooling employment lowers near-term rate hike odds, supporting gold; however, the 10-year Treasury yield remains near 5.2% and rising energy prices cap the upside. Monday's US calendar is relatively light, shifting short-term focus to Treasury yields, the dollar, and oil prices. The next major policy milestones this week are US CPI on October 14 and US PPI on October 15.
II. Periodic Technical Analysis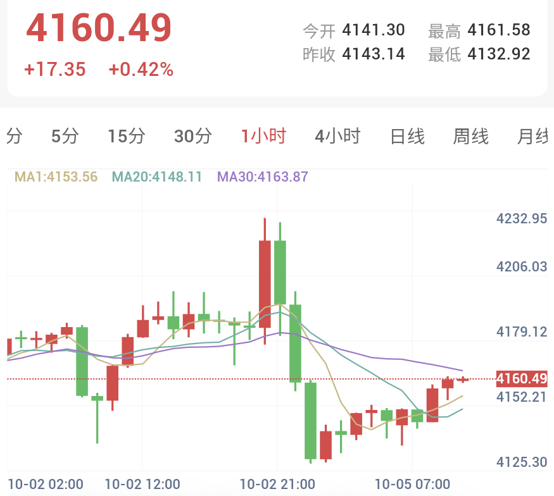
1-Hour Timeframe (Intraday Short-Term: Low-Level Rebound Repair): Gold currently trades around 4160.49, with an intraday high of 4161.58 and a low of 4132.92. Prices have reclaimed MA1 and MA20, though sitting slightly below MA30. Structurally, following the swift sell-off from the 4215—4220 zone down toward 4125 last week, gold has entered a low-level repair phase, though it has yet to decisively break MA30 and overhead resistance. Currently, 4150—4164 serves as the primary demand zone and the area being contested. Sustained stabilization above 4164 is required for short-term conditions to further test 4188—4198.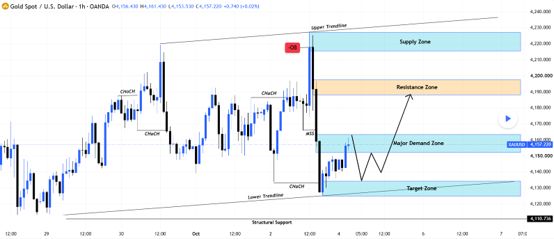
Key 1-Hour Structure Levels:
- Current Demand Zone (4150—4164): Gold is currently operating within this zone. Initial buying reactions can occur here, but having rebounded near the upper boundary of the range, it is not an ideal spot to chase longs.
- Key Support / Liquidity Zone (4125—4135): This area converges with prior lows and the ascending trendline, making it a more valuable downside observation zone in the current structure. If gold pulls back here, sweeps liquidity near 4130, and rapidly recovers with higher lows or a clear bullish structural shift, the reliability of this rebound will increase significantly.
- Structure Invalidation Level (Near 4110): 4110.74 represents critical support for the current 1-hour structure. If H1 sustains trading below 4110, the repair logic initiated from lows is effectively invalidated, and gold may resume a larger bearish trend.
III. Trading Execution Plan
Unlike previous days, today I believe "shorting bounces" is no longer suitable as the sole primary plan. Following significantly weaker NFP data, rate hike expectations have declined; meanwhile, gold has suffered consecutive steep drops, forming clear technical support near 4125—4135. Therefore, today favors:
Strategy Direction: Look to buy after pullbacks
Trading Signal: Buy (Conditional Trigger)
Confidence Index: 60 / 100
Core Observation Range: 4110—4225
Current Demand Zone: 4150—4164
Key Buying Observation Zone: 4125—4135
Structure Invalidation: Below 4110
First Target: 4150—4164
Second Target: 4188—4198
Third Target: 4215—4225
[Execution Details]
With prices returning near 4160, chasing longs directly is unadvisable. The ideal scenario is for gold to re-test the pullback zone at 4125—4135. If entering this region yields rapid downside sweeps and recoveries, prominent long lower shadows, higher lows, or bullish MSS/CHoCH structural strengthening on 1-hour or lower timeframes, long opportunities can be monitored.
The initial step is watching prices reclaim 4150—4164. Should 4164 be firmly secured, overhead attention shifts to 4188—4198, which is today's crucial resistance zone; failure to break through could see gold slide back into a choppy, weak structure. A decisive breakout above 4188—4198 is required before the next target shifts upward to 4215—4225.
Conversely, if prices breach 4310... wait, if prices break below 4130 and H1 decisively closes below 4110, the pullback-buying thesis is invalidated, and low-level bounce logic no longer applies.
One final note: Last Friday following the NFP release, gold briefly surged near $4,223 before swiftly tumbling back toward $4,140, indicating the market remains highly cautious regarding any "Fed pivot" trades. Thus, even choosing to buy on pullbacks today should be defined as a repair trade rather than a trend reversal.
IV. Risk Warning
Trading markets involve unpredictable risks, including but not limited to principal loss. This analysis is for reference only and does not constitute direct investment advice. Investors should make independent judgments and autonomous decisions based on their own risk tolerance.
NFP Plunges, But Surging Energy Prices Cap Gold's Rebound (2026/10/05)
Published: 2026-10-05 10:19:02