

I. Market Overview: Short-Term Faces Critical Resistance Test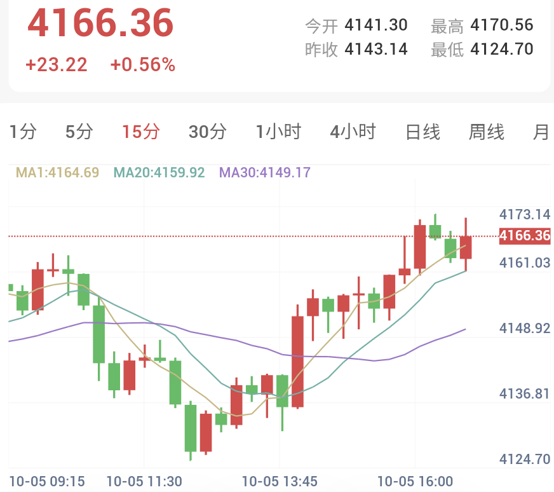
Structural Evolution:
Gold demonstrated a classic liquidity-driven structure on the 15-minute timeframe.
Earlier, prices induced buyers and precisely swept buy-side liquidity (BSL) near 4226.91 before aggressive sellers swiftly took control.
The market subsequently shifted into a distribution phase with accelerated declines, bottoming out at 4124.70.
Current Market State:
After touching bottom support, bullion staged a technical rebound, currently trading near 4166.36.
Prices have now pushed entirely into the core Fair Value Gap (FVG, 4160.00 - 4170.00) left behind by the prior downward leg.
This zone represents a critical defensive stronghold for sellers, confronting short-term price action with a directional choice.
II. Technical Analysis: Indicator and Pattern Interaction
On the latest 15-minute chart, short-term moving averages (MA1: 4164.69, MA20: 4159.92, MA30: 4149.17) fan upward, signaling that rebound momentum remains active.
However, the intraday high at 4170.56 has precisely tested the upper boundary of the FVG resistance zone.
Path Projections:
1. Bearish Continuation (Baseline Scenario):
The current rebound can be viewed as an upward rebalancing of the prior bearish imbalance zone (4160.00 - 4170.00).
Should prices display exhaustion or reversal signals here, it would confirm heavy overhead selling pressure, resuming the downtrend toward 4150.00 and down to the 4124.00 - 4134.00 support zone.
2. Bullish Breakout (Alternative Scenario):
If bullish momentum surges and a 15-minute candle body decisively breaks and closes above 4170.00, the bearish continuation thesis is invalidated.
The market would then open deeper upside room, gravitating toward prior liquidity highs.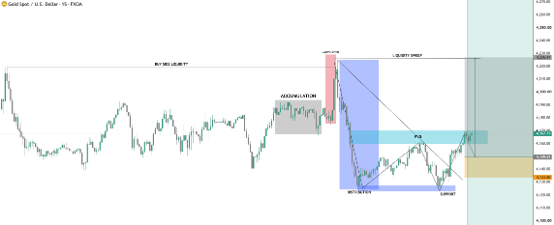
III. Key Price Levels
Upper Liquidity High (Strong Resistance): 4226.91
Core Bearish Imbalance Zone (FVG Resistance): 4160.00 - 4170.00 (Intraday High Tested: 4170.56)
Short-Term Structural Pivot (Preliminary Support): 4150.00
Bottom Demand Support Zone (Critical Defense): 4124.00 - 4134.00 (Intraday Low: 4124.70)
IV. Trading Plan
1. Short on Resistance (Primary Strategy):
The current price at 4166.36 sits directly inside the 4160.00 - 4170.00 core resistance band; avoid chasing longs here.
Closely monitor 15-minute candle behavior in this zone. If exhaustion signals such as long upper shadows or bearish engulfing patterns emerge, initiate short positions.
Set defensive stop-loss above 4172.00, targeting 4150.00 initially, and extending toward 4134.00 upon a breakdown.
2. Follow Breakout Long (Alternative Strategy):
If prices bypass resistance and print a solid bullish candle closing decisively above 4170.00, the bearish defensive barrier is broken.
Traders should abandon shorts and wait for a retest of 4160.00 - 4170.00 (resistance-turned-support) to enter longs, targeting the 4195.00 - 4200.00 zone.
V. Risk Warning
Trading markets involve unpredictable risks, including but not limited to the loss of principal.
This analysis is for reference only and does not constitute direct investment advice. Investors should make independent judgments and autonomous decisions based on their own risk tolerance.
Gold Rebounds from Lows, Testing Crucial Resistance for Directional Cue
Published: 2026-10-05 17:08:00