

I. Fundamental Analysis
Spot gold welcomed a technical rebound early this morning.
US President Donald Trump stated that the US will not launch military strikes against Iran prior to the November 3 midterm elections, describing recent talks as 'very fruitful.'
However, he concurrently emphasized that naval blockades on Iranian ports will remain fully enforced.
While pausing direct military attacks offers a de-escalation signal, the ongoing maritime blockade keeps Middle East geopolitical frictions unresolved.
On monetary policy, St. Louis Fed President Alberto Musalem noted that further rate hikes over the next six to nine months remain necessary to bring inflation back to 2%.
Nonetheless, he has yet to reveal a definitive voting inclination for the upcoming October 27–28 FOMC meeting.
For today's trading, these developments present complex macro crosscurrents: geopolitical risks persist, while Fed tightening prospects remain active.
Whether bullion can sustain its recovery depends directly on how prices interact with overhead resistance.
II. Periodic Technical Analysis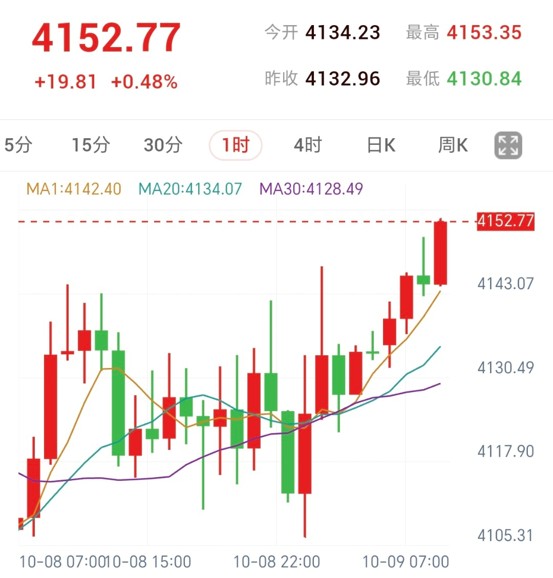
1-Hour Timeframe (Short-Term Rebound Stronger, Watching Resistance Reactions):
Gold currently trades around $4,152.77, advancing $19.81 or 0.48% intraday.
The session has logged an intraday high of $4,153.35 against a low of $4,130.84.
Regarding moving averages, MA1 sits at $4,142.40, MA20 at $4,134.07, and MA30 at $4,128.49.
Prices are running above all three moving averages, with candles printing sequential higher highs and averages fanning upward in a bullish configuration.
Because current quotes hover near intraday peaks, the preference is to monitor pullback support rather than chasing highs impulsively.
Overhead focus rests primarily on the core resistance zone between $4,165 and $4,185.
While short-term buying has lifted prices, there is no conclusive confirmation of a volume-backed breakout above this barrier, keeping the move classified as a technical correction.
Downside attention focuses on $4,142.40 and the $4,134.07—$4,130.84 zone (coinciding with MA20 and session lows).
Whether buyers defend these levels on pullbacks will serve as an essential indicator of rebound durability.
A sustained breach below this support band would require adjusting the constructive short-term thesis.
III. Trading Execution Plan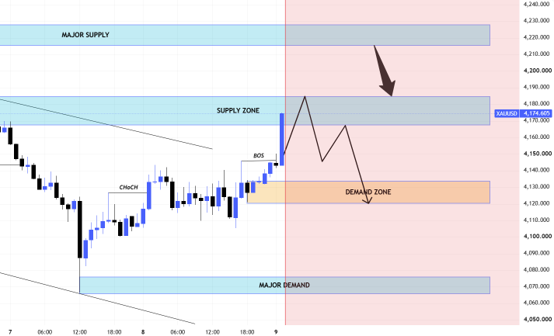
Strategy Direction: Monitor selling opportunities upon resistance rejection (awaiting confirmation)
Observation Zone: 4165—4185
Trigger Condition: Rejection within the zone, forming lower highs and breaking beneath local intraday lows
Downside Targets: Initial target at 4142.40, secondary target at 4130.84—4134.07; reassess if price stabilizes with higher lows
Invalidation Condition: 1-hour candle body closing and sustaining above 4190 cancels the short setup
Stop-Loss Reference: Determined upon confirmed entry structure (4190 represents scenario invalidation, not a static stop)
[Execution Details]
If price pulls back first during the session, closely assess buying absorption around 4142.40 and 4130.84—4134.07.
A decisive break below 4130.84 without immediate recovery warrants pausing dip-buying observations.
Touching price levels alone does not constitute entry; remain patient until confirmation signals materialize.
IV. Risk Warning
Geopolitical headlines and Fed communications can trigger sharp price volatility, and technical resistance bands carry the risk of being breached directly.
This plan is for reference only; triggers and invalidations must be evaluated alongside unfolding price action without performance guarantees.
Gold Rebounds Toward Critical Resistance (2026/10/09)
Published: 2026-10-09 10:03:04