

Analyst: Liu Cuisi
I. Fundamental Market Analysis
1. De-escalation in Iran Tensions Sends Energy Prices Lower:
US President Donald Trump stated that the US will not launch military attacks against Iran prior to the November midterms, noting that 'productive' talks are underway to conclude the conflict.
These comments significantly calmed market fears over sudden energy supply disruptions.
On October 9, both Brent and WTI crude fell by approximately 1.3%.
Easing energy prices softened inflation concerns, creating conducive conditions for lower Treasury yields and a precious metals rebound.
However, Iran's Revolutionary Guard previously warned of 'illicit maritime corridors' in the Strait of Hormuz.
As long as supply risks remain unaddressed, energy markets remain vulnerable to renewed volatility.
2. Year-End Fed Rate Hike Expectations Persist:
St. Louis Fed President Alberto Musalem noted that further policy tightening may be required to bring inflation back to the 2% target.
However, he stopped short of confirming whether action would be taken at the next meeting.
According to CME FedWatch pricing, the probability of an October rate hike stands near 17%, while December odds remain elevated at 83%.
The next FOMC rate decision is scheduled for October 27–28.
While earlier soft non-farm payroll data tempered October hike bets, hawkish FOMC minutes revealed that most policymakers favor another rate increase this year.
With borrowing costs projected to stay elevated longer than expected, gold's valuation continues to face medium-term pressure.
II. Gold Technical Analysis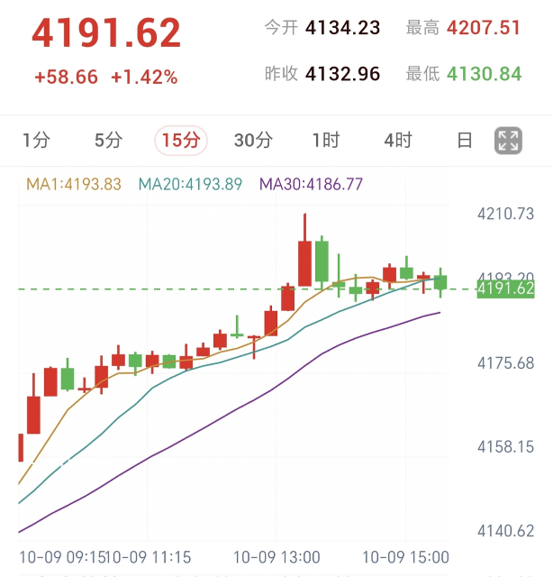
Daily Timeframe:
Spot gold opened at $4,134.23/oz during Asian trade, reaching an intraday high of $4,207.51 against a low of $4,130.84.
It currently trades near $4,191.62/oz, up roughly 1.42% on the day.
While price has reclaimed the $4,200 psychological mark, daily moving averages remain in a bearish death-cross formation, keeping the broader trend tilted downward.
Traders should monitor pullback reactions post-rebound before considering medium-term short setups, avoiding chasing impulsive upward moves.
15-Minute Timeframe:
On the 15-minute chart, moving averages reflect a bullish alignment, with price hovering near the 20-period MA at $4,193.89.
After logging fresh session highs early on, stabilization on a retest of $4,190 would keep short-term long setups viable.
The prior breakout confirmation level sits near $4,161.
Stops can reference the intraday low of $4,130.84, with targets structured around at least a 2:1 risk-reward ratio or trailing moving averages.
A break below $4,180 would weaken the short-term bullish thesis, warranting a step to the sidelines.
III. Silver Technical Analysis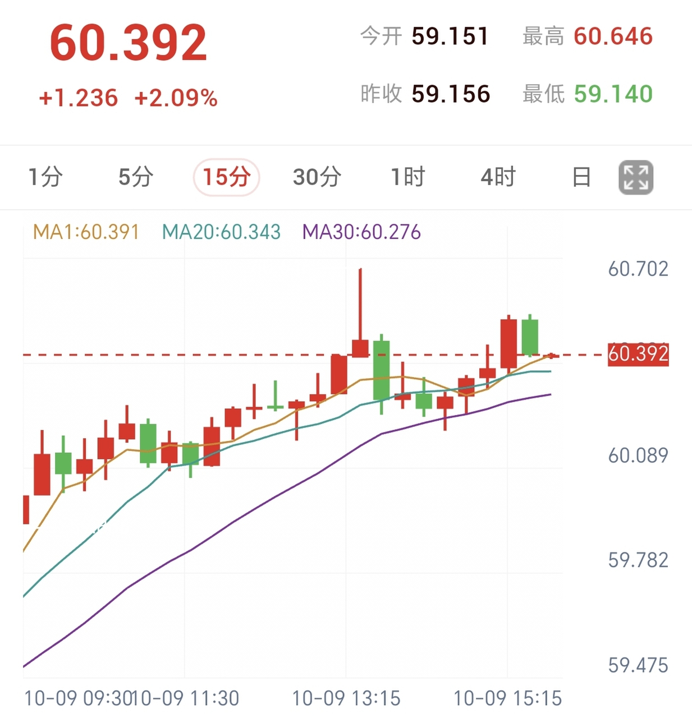
Daily Timeframe:
Spot silver opened at $59.151/oz today, recording an intraday high of $60.646 against a low of $59.140.
It currently trades near $60.392/oz, up approximately 2.09% intraday.
Silver's daily moving averages remain in a golden cross, though the 20-period MA slopes downward with price beneath the 80-period MA.
Because the medium-term trend lacks structural alignment, traders should wait for price and moving averages to converge with key support before positioning.
15-Minute Timeframe:
The 15-minute moving averages display a bullish posture, with price holding above the 20-period MA at $60.343.
If silver holds support on a pullback toward $60.34, short-term long opportunities remain valid.
The breakout and confirmation level above the 20-period MA was established near $60.34.
Stops can be anchored to the intraday low of $59.140, setting targets at a 2:1 risk-reward ratio or managed dynamically via moving averages.
A breach below $60.10 would advise closing short-term longs and awaiting fresh directional confirmation.
IV. Key Factors to Watch Ahead
Although gold and silver have rebounded, macroeconomic uncertainties remain prominent.
Participants should track:
1. Whether US inflation, labor, and consumer data continue to decelerate;
2. Potential shifts in Fed officials' rate hike rhetoric for the year;
3. Whether 10-year Treasury yields can sustain their downward trajectory;
4. Geopolitical shifts in Iran that could reignite energy supply risks;
5. Support-resistance transitions near $4,200 for gold and $60.34 for silver.
Continued softening in yields and the greenback could extend this precious metals recovery.
Conversely, hotter inflation prints or hawkish Fed rhetoric would reintroduce pullback risks across bullion markets.
V. Risk Warning
Trading precious metals and derivative contracts carries substantial financial risk, with sharp volatility driven by macro data, policy guidance, geopolitics, and liquidity shifts.
This analysis is provided for market information and technical reference only and does not constitute investment advice. Investors should make independent decisions aligned with their risk tolerance.
US Dollar and Treasury Yields Retreat, Gold and Silver Stage Oversold Rebound
Published: 2026-10-09 16:01:44