

Author: Analyst Lu Mingyu
I. Market Overview: Can the Rebound Extend? Gauging Reaction at $4,175 Support
Following its pullback from recent highs, spot gold faces an immediate test of underlying support.
Current market attention centers on two core variables: whether demand absorbs the pullback near $4,175.00, and how the upcoming US CPI release shapes expectations for the Federal Reserve's rate path.
While the CPI print could catalyze elevated price volatility, the sustainability of any rebound hinges on reclaiming recently breached technical structures.
At present, gold remains in a corrective retreat; bulls must see concurrent improvements across price action and technical indicators to confirm a resumption of the uptrend.
II. Technical Analysis: Prices Slip Below Short-Term Moving Averages as Bears Retain Control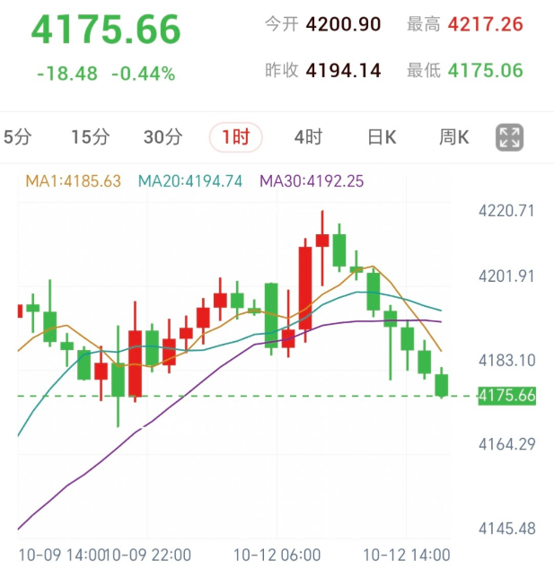
Price and Moving Average Structure:
On the 1-hour chart, gold touched an intraday high of $4,217.26 before encountering noticeable profit-taking pressure.
With the current quote trading near $4,175.66, prices have fallen beneath all three short-term moving averages:
MA1: $4,185.63
MA20: $4,194.74
MA30: $4,192.25
This bearish moving average configuration indicates that sellers currently maintain control over near-term price discovery.
The previous support zone at $4,180.00—$4,185.00 has been breached; monitoring whether rallies can decisively reclaim this band is essential, as failure to do so will keep upward moves capped.
Technical Indicator Conditions:
To confirm a short-term bullish continuation, price needs to establish solid footing above EMA09 with moving averages fanning upward; continued rejection below EMA09 will amplify downside risks.
Concurrently, the Relative Strength Index (RSI) must cross and stabilize above the 50 neutral threshold to validate improving upside momentum.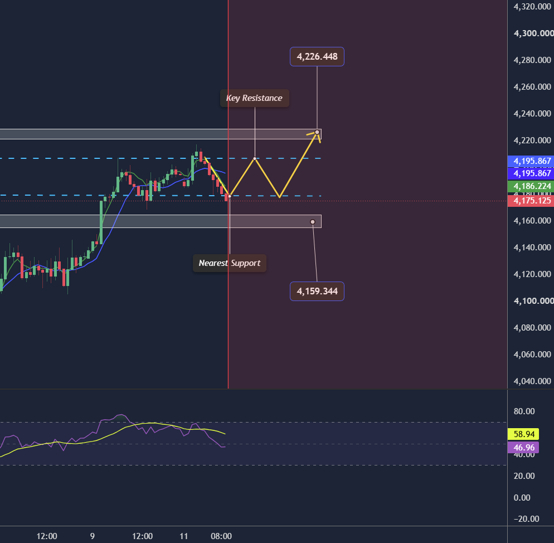
III. Key Price Levels
Reclamation Zone: $4,180.00—$4,185.00 (Prior support breached; watch for stabilization on retests)
Overhead Resistance: $4,200.00—$4,207.00 (Immediate barrier and profit-taking supply area)
Secondary Resistance: $4,220.00—$4,230.00 (Higher target zone upon a clean breach of 4207.00)
Near-Term Support: Around $4,175.00 (Primary focus on floor confirmation)
Lower Support Zone: $4,155.00—$4,165.00 (Key downside target should the pullback extend)
IV. Trading Execution Plan: Await Confirmation Before Entering
1. Short on Rejection (Fade Rallies):
Monitor price action closely within the $4,205.00—$4,208.00 zone; consider short entries if clear exhaustion or rejection candles emerge.
Entry Observation Zone: $4,205.00—$4,208.00
Stop-Loss Reference: $4,213.00
Take-Profit Targets: 40 / 80 / 200 / 300 pips
2. Long on Confirmed Stabilization:
Long positions require price to first reclaim $4,180.00—$4,185.00 and subsequently confirm support on a pullback to $4,180.00—$4,183.00; while trading below this zone, conditions for buying remain unfulfilled.
Entry Observation Zone: $4,180.00—$4,183.00
Stop-Loss Reference: $4,175.00
Take-Profit Targets: 40 / 80 / 200 / 300 pips
V. Risk Warning
Trading financial markets involves unpredictable risks, including the potential loss of principal.
This analysis is provided for educational and market reference only and does not constitute direct investment advice. Investors should make autonomous decisions aligned with their individual risk tolerance.
Gold Retreats Under Pressure: Eyeing $4,175 Support and Upcoming CPI Data
Published: 2026-10-12 16:35:37