

I. News Event: Strait of Hormuz Peace Proposal Rejected, Red Sea Energy Routes Threatened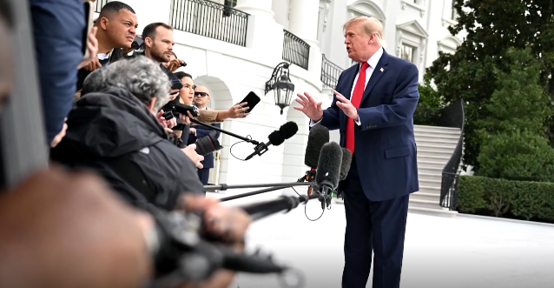
The US side rejected Iran's peace proposal to reopen the Strait of Hormuz, stating that Iran's conditions were unacceptable.
Trump told reporters at the White House, "They want to make a deal right away, open up the Strait of Hormuz immediately, because they're getting beaten so badly." He added that he expects further negotiations to take place this week and will continue pushing forward.
Meanwhile, the Iranian side insisted that only diplomatic channels can break the current stalemate, stating they are awaiting official feedback from mediators and emphasizing that "if Iran cannot trade, if Iran cannot survive, then nobody trades or survives."
The Middle East conflict has further spread to surrounding regions. The advancement of Yemen's Houthi movement poses a severe threat to Saudi Arabia's Red Sea export routes, prompting schools in the Saudi capital of Riyadh to notify parents of a shift to remote learning, signaling escalating regional tensions.
Concurrently, airstrikes hit southwestern Yemen, causing multiple civilian casualties and showing no signs of easing military confrontation intensity in the Middle East.
II. 30-Minute Chart: Gold Suffers Precipitous Crash, Short-Term Moving Averages Slope Sharply Downward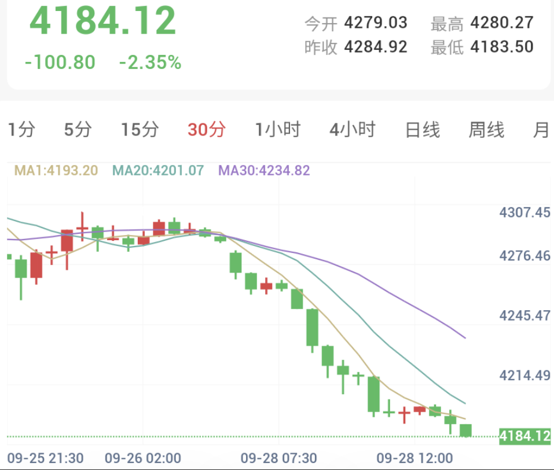
As of approximately 13:39 Beijing time, spot gold traded at $4,184.12 per ounce, suffering a severe intraday plunge of 2.35% (down $100.80).
From a moving average perspective, gold exhibited a highly destructive unilateral cliff-like breakdown. Following the collapse of the platform near $4,280 in early morning trade, candlesticks printed consecutive large-scale bearish bars in a vertical descent.
Current moving averages MA1 ($4,193.20), MA20 ($4,201.07), and MA30 ($4,234.82) formed an extremely steep bearish downward divergence alignment. Prices are firmly pinned beneath all short-term moving averages.
III. 30-Minute Technical Indicators: Core Sensitive Indicators Smash Into Extreme Oversold Zones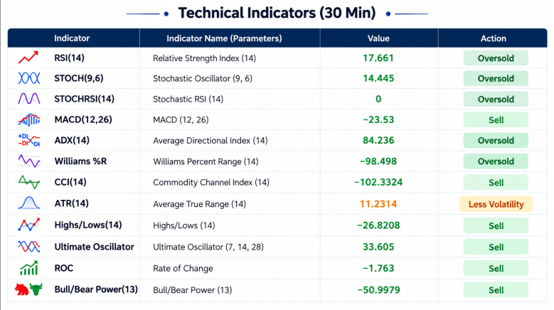
On the 30-minute technical front, the overall assessment reads "Strong Sell" with overwhelming bearish momentum. However, due to the overly brutal short-term liquidation, multiple core sensitive indicators have smashed into historical extreme oversold blind spots:
Core Relative Indicators Plunge Deep Into Oversold:
Relative Strength Index RSI(14) plummeted to 17.66, plunging deep into extreme oversold territory; Stochastic STOCH(9,6) registered 14.45, in an extreme oversold state; Commodity Channel Index CCI(14) printed -102.33, maintaining a sell rating.
Trend Momentum Indicators Extremely Bearish:
Mid-term momentum indicator MACD(12,26) printed -23.53, diverging sharply below the zero line and issuing a strong sell signal; Trend strength indicator ADX(14) reached an exceptionally rare 84.24, indicating extreme coherence in current unilateral panic selling; Rate of Change ROC printed -1.763, and Bull/Bear Power(13) printed -51.00, showing absolute seller dominance.
Oscillator and Sensitive Indicators Hit Bottom Across the Board:
StochRSI(14) printed 0.00, hitting absolute oversold extremes; Williams %R printed -98.50, smashing directly into deep oversold blind spots; Highs/Lows(14) recorded -26.82, reflecting severe downward shifting of price gravity.
IV. Summary
Today's crash-like collapse in gold markets reflects heavy gravity suppression. The abortion of peace proposals between the US and Iran over the Strait of Hormuz and escalating warfare along the Red Sea coast heavily weighed on gold, ultimately causing the collapse of bullish defenses and a surge of panic selling.
Combined with 30-minute charts and technical indicators, gold's single-day plunge exceeding $100 and ADX surging above 84 confirm the extreme ferocity of the downside trend. However, RSI breaking below 20, StochRSI zeroing out, and Williams %R nearing -100 strongly suggest that short-term bearish liquidation has been severely overextended.
Gold Plunges Over $100 as Trump Rejects Iran Peace Deal
Published: 2026-09-28 13:54:09