

I. News Events
1. Global Bond Sell-Off Deepens, Sovereign Yields Hit Multi-Decade Highs
On Thursday, global bond markets faced severe selling pressure as long-term borrowing costs surged drastically. The US 10-year Treasury yield touched 5.34%, marking its highest record since 2002. This sell-off was not confined to the US; France's 10-year bond yield approached 5%, hitting a peak unseen since 2002, while the UK's 30-year bond yield broke above 6%, reaching its highest level since 1998.
Aside from inflation concerns triggered by rising base energy prices, the boom in frontier tech sectors like artificial intelligence intensified capital competition, which, combined with escalating sovereign debt burdens globally, jointly drove up long-term rate pricing.
2. Cooling Inflation Triggers Plunge in Rate Hike Expectations as Markets Await NFP Report
Despite soaring long-term bond yields, recently released US August inflation data showed that price increases came in lower than expected, with prior-month price pressures remaining modest. This marginal cooling in inflation data significantly undermined the Federal Reserve's backing for aggressive short-term tightening.
Currently, interest rate futures traders have seen the expected probability of a rate hike this month plummet from around 75% earlier in the week to just 28%. The absolute focus of the market has now shifted to the upcoming September US non-farm payrolls report, the strength of which will directly determine the ultimate trajectory of rate hike expectations.
II. 30-Minute Chart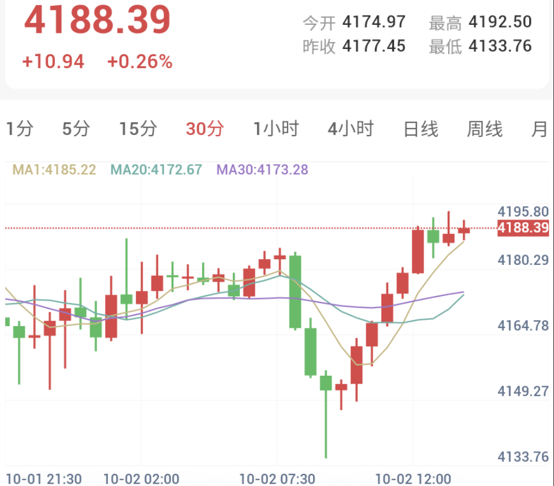
As of approximately 13:41 Beijing time, spot gold traded at $4,188.39 per ounce, up $10.94 or 0.26% intraday.
Combined with the 30-minute chart, gold ushered in a strong oversold rebound after probing a deep intraday low of $4,133.76. Currently, MA20 ($4,172.67) and MA30 ($4,173.28) have formed a golden cross at the bottom and fanned upward, cooperating with MA1 ($4,185.22) hugging the candles to construct a clear bullish support band.
Prices have firmly established themselves above the moving average system, trading near intraday highs as the early session sharp drop was thoroughly reversed by a vertical bullish surge.
III. 30-Minute Technical Indicators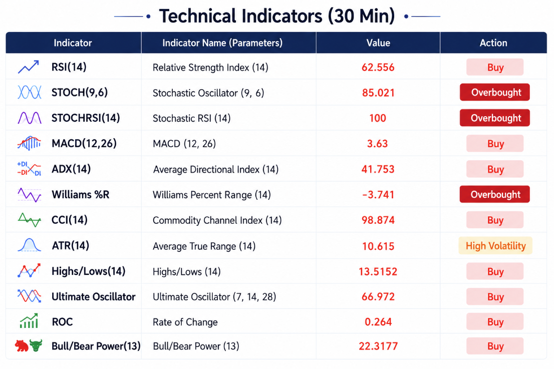
The overall technical assessment reads "Strong Buy," with 8 bullish indicators, 0 neutral, and 0 bearish. Short-term bullish momentum has erupted, broken down as follows:
Core Relative Indicators:
Relative Strength Index RSI(14): 62.56, in a strong bullish buying channel; Stochastic STOCH(9,6): 85.02, entering high overbought territory; Commodity Channel Index CCI(14): 98.87, maintaining a buy rating.
Trend Momentum Indicators:
Mid-term momentum MACD(12,26): 3.63, issuing a clear buy signal; Trend strength ADX(14): 41.75, showing robust current rebound momentum; Rate of Change ROC: 0.264, and Bull/Bear Power(13): 22.32, both signaling buys with abundant buying power.
Oscillator/Sensitive Overbought-Oversold Indicators:
StochRSI(14): 100.00, hitting absolute overbought extremes; Williams %R: -3.74, plunging deep into extreme overbought territory; Average True Range ATR(14): 10.62, exhibiting high volatility features (High Volatility).
IV. Summary
Although long-term macro gravity remains severe, intraday gold prices staged a violent rebound from the $4,133.76 low, driven fundamentally by the "correction in policy expectation mismatches." Due to mild preliminary inflation data, market pricing for a direct rate hike this month has plunged to below 30%, a loosening of short-term expectations that directly triggered profit-taking short-coverings and technical buying from low levels.
The 30-minute chart has now returned above $4,188, with moving averages turning into bullish support. However, both StochRSI and Williams %R have smashed into extreme overbought blind spots, implying that short-term chasing momentum faces technical rotation pressure at any time.
Tonight's non-farm payrolls report will command the subsequent direction: if data prints unexpectedly soft, gold is poised to leverage momentum to challenge the $4,200 psychological handle; if the labor market remains resilient, tightening expectations could make a comeback, forcing the market to re-test support near the $4,172 dense moving average band and intraday lows.
Global Bond Sell-Off Continues, Gold Bounces Ahead of NFP
Published: 2026-10-02 13:51:17